Technical Analysis of TOUS 2024-05-10
Overview:
In analyzing the technical indicators for TOUS stock over the last 5 days, we will delve into the trend, momentum, volatility, and volume indicators to provide a comprehensive outlook on the possible future stock price movement. By examining these key indicators, we aim to offer valuable insights and predictions for the upcoming trading days.
Trend Analysis:
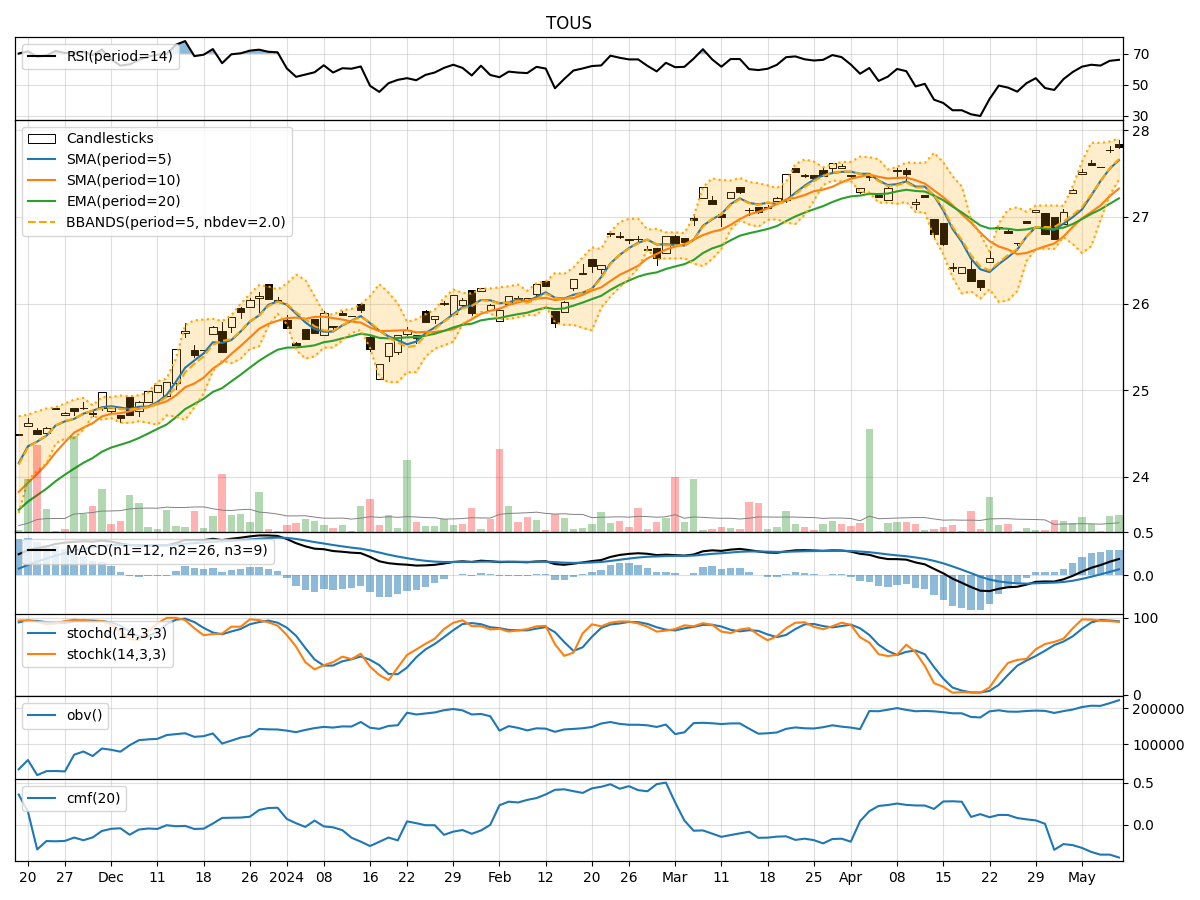
- Moving Averages (MA): The 5-day Moving Average (MA) has been consistently above the Simple Moving Average (SMA) and Exponential Moving Average (EMA), indicating a bullish trend.
- MACD: The MACD line has been consistently above the signal line, with both lines showing an upward trajectory, suggesting a bullish momentum.
- RSI: The Relative Strength Index (RSI) has been in the range of 60-70, indicating a neutral to slightly bullish sentiment.
Momentum Analysis:
- Stochastic Oscillator: The Stochastic Oscillator has been hovering around the overbought territory, suggesting a potential reversal or consolidation.
- Williams %R: The Williams %R indicator has been fluctuating in the oversold region, indicating a potential buying opportunity.
Volatility Analysis:
- Bollinger Bands (BB): The price has been trading within the Bollinger Bands, with the bands narrowing, indicating reduced volatility.
- Average True Range (ATR): The ATR has shown a decrease in volatility over the past few days.
Volume Analysis:
- On-Balance Volume (OBV): The OBV indicator has been relatively stable, indicating a balance between buying and selling pressure.
- Chaikin Money Flow (CMF): The CMF has been negative, suggesting a bearish money flow trend.
Key Observations:
- The trend indicators suggest a bullish sentiment in the short term.
- Momentum indicators show signs of potential reversal or consolidation.
- Volatility has decreased, indicating a possible period of price stability.
- Volume indicators reflect a balanced market sentiment with a slight bearish bias.
Conclusion:
Based on the analysis of the technical indicators, the next few days for TOUS stock are likely to see sideways consolidation with a slight bullish bias. Traders may consider monitoring key support and resistance levels for potential entry and exit points. It is essential to remain cautious of any sudden shifts in market dynamics and adjust trading strategies accordingly.