Technical Analysis of TPLC 2024-05-10
Overview:
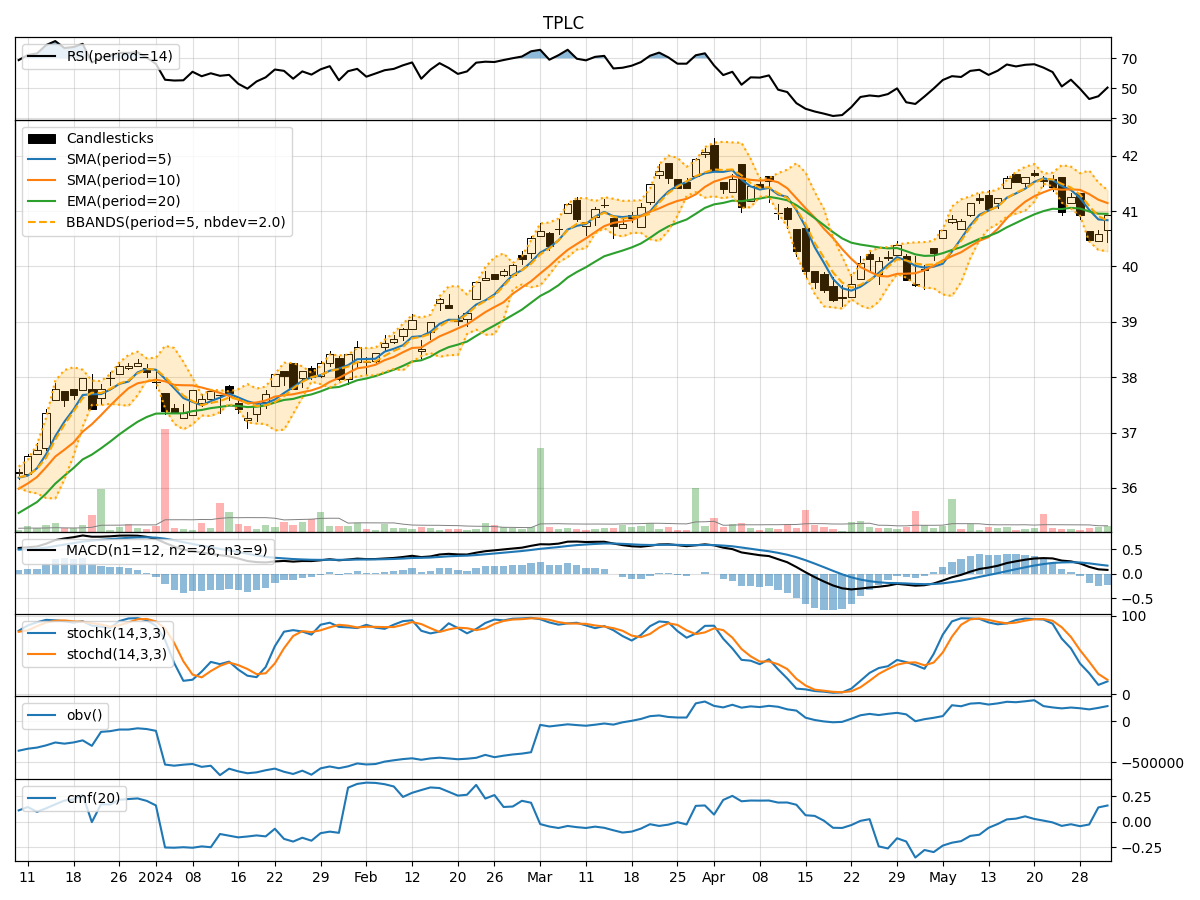
In analyzing the technical indicators for TPLC over the last 5 days, we will delve into the trend, momentum, volatility, and volume indicators to provide a comprehensive outlook on the possible stock price movement. By examining these key aspects, we aim to offer valuable insights and predictions for the upcoming days.
Trend Analysis:
- Moving Averages (MA): The 5-day Moving Average (MA) has been consistently above the Simple Moving Average (SMA) and Exponential Moving Average (EMA), indicating a bullish trend.
- MACD: The MACD line has been above the signal line, with both lines showing an upward trend, suggesting bullish momentum.
- MACD Histogram: The MACD Histogram has been increasing, indicating strengthening bullish momentum.
Momentum Analysis:
- RSI: The Relative Strength Index (RSI) has been trending upwards and is currently in the overbought territory, suggesting a strong bullish momentum.
- Stochastic Oscillator: Both %K and %D lines of the Stochastic Oscillator are in the overbought zone, indicating a potential reversal or consolidation.
- Williams %R: The Williams %R is in the oversold region, signaling a potential reversal to the upside.
Volatility Analysis:
- Bollinger Bands (BB): The stock price has been trading within the Bollinger Bands, with the bands widening slightly, indicating increased volatility.
- Bollinger Band %B: The %B indicator is below 1, suggesting the price is closer to the lower band, potentially indicating an oversold condition.
Volume Analysis:
- On-Balance Volume (OBV): The OBV has been increasing over the last 5 days, indicating accumulation by investors.
- Chaikin Money Flow (CMF): The CMF has been negative, suggesting selling pressure in the stock.
Conclusion:
Based on the analysis of the technical indicators: - Trend: The stock is in a strong bullish trend. - Momentum: The momentum is bullish but showing signs of potential reversal due to overbought conditions. - Volatility: Volatility has increased slightly, indicating potential price swings. - Volume: Accumulation is observed, but selling pressure is also present.
Forecast:
Considering the overall analysis, the stock is likely to experience further upward movement in the next few days, but caution is advised due to the overbought signals in momentum indicators. Traders should monitor for potential signs of consolidation or a minor pullback before considering new long positions.