Technical Analysis of TPLE 2024-05-10
Overview:
In analyzing the technical indicators for TPLE over the last 5 days, we will delve into the trend, momentum, volatility, and volume indicators to provide a comprehensive outlook on the possible stock price movement in the coming days. By examining these key aspects, we aim to offer valuable insights and predictions for potential investors or traders.
Trend Analysis:
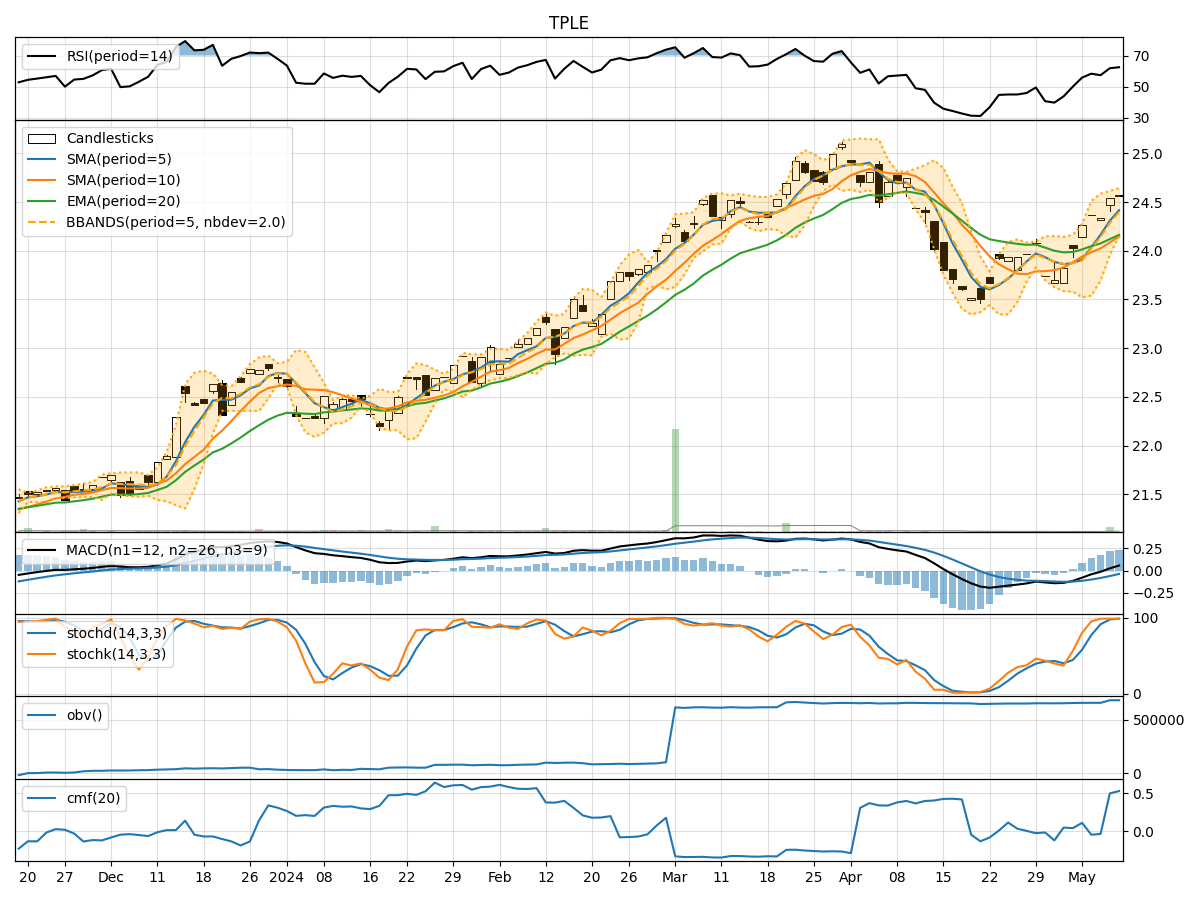
- Moving Averages (MA): The 5-day Moving Average (MA) has been consistently above the Simple Moving Average (SMA) and Exponential Moving Average (EMA), indicating a short-term bullish trend.
- MACD: The MACD line has been above the signal line, with both lines showing an upward trend, suggesting bullish momentum.
- Conclusion: The trend indicators point towards an upward trend in the stock price.
Momentum Analysis:
- RSI: The Relative Strength Index (RSI) has been increasing and is currently in the overbought territory, indicating strong buying momentum.
- Stochastic Oscillator: Both %K and %D lines are in the overbought zone, suggesting a potential reversal or consolidation.
- Conclusion: The momentum indicators signal a strong bullish sentiment in the market.
Volatility Analysis:
- Bollinger Bands (BB): The stock price has been trading within the upper Bollinger Band (BBU), indicating high volatility.
- Conclusion: The volatility indicators suggest increased volatility in the stock price.
Volume Analysis:
- On-Balance Volume (OBV): The OBV has been increasing, reflecting higher buying volume in the stock.
- Chaikin Money Flow (CMF): The CMF is positive, indicating strong buying pressure.
- Conclusion: The volume indicators point towards positive accumulation in the stock.
Key Observations and Opinions:
- The trend and momentum indicators align in signaling a bullish outlook for TPLE.
- Volatility is high, which could lead to sharp price movements in the coming days.
- The increasing OBV and positive CMF indicate strong buying interest in the stock.
Conclusion:
Based on the analysis of the technical indicators, it is highly likely that TPLE will experience further upward movement in the next few days. Traders and investors may consider taking long positions or holding onto existing positions to capitalize on the bullish momentum. However, it is essential to closely monitor the stock for any signs of overbought conditions or potential reversals given the high volatility. Overall, the outlook for TPLE appears bullish in the short term.