Technical Analysis of TPMN 2024-05-10
Overview:
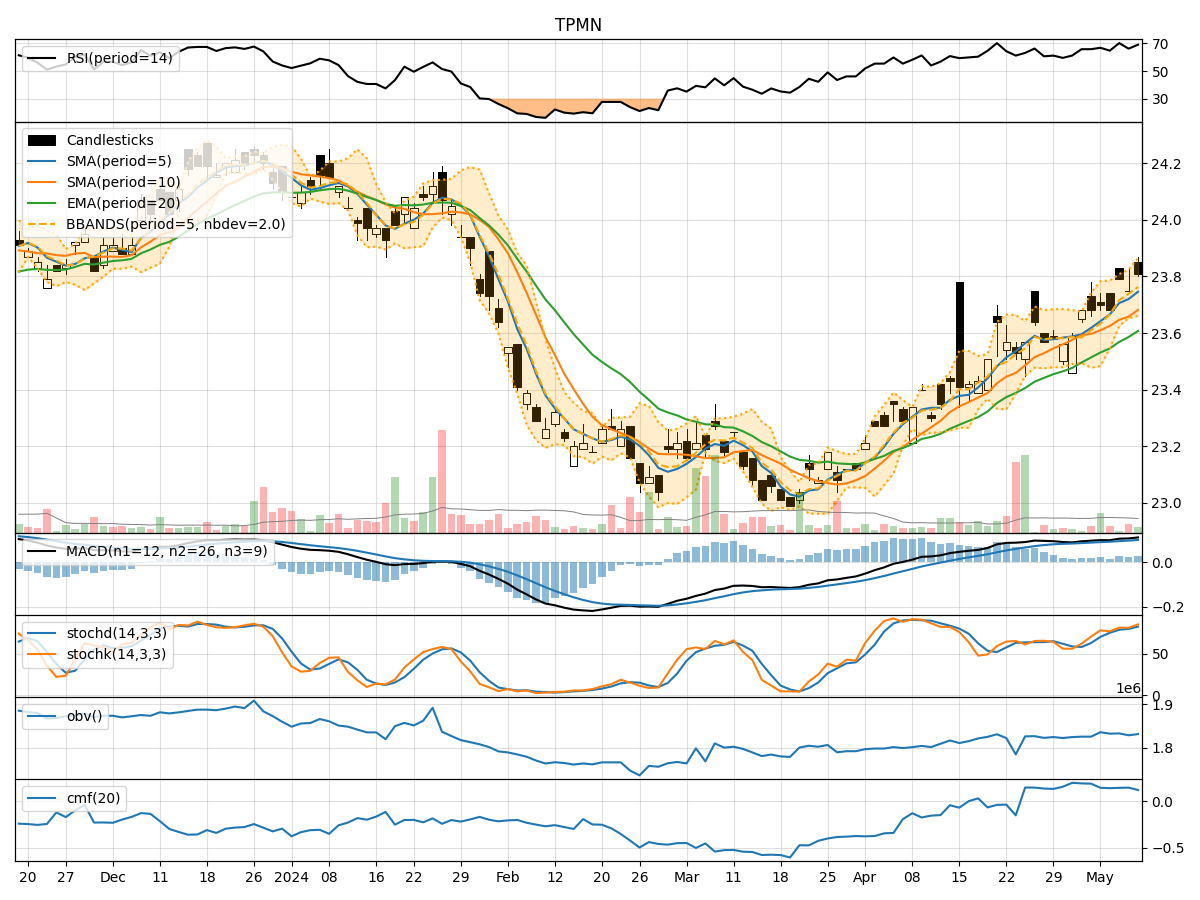
In analyzing the technical indicators for TPMN stock over the last 5 days, we will delve into the trends, momentum, volatility, and volume aspects to provide a comprehensive outlook on the possible stock price movement in the coming days. By examining key indicators such as moving averages, MACD, RSI, Stochastic Oscillator, Bollinger Bands, OBV, and Chaikin Money Flow, we aim to offer valuable insights and predictions for potential price movements.
Trend Analysis:
- Moving Averages (MA): The 5-day MA has been consistently above the closing price, indicating a short-term uptrend.
- MACD: The MACD line has been trending upwards, staying above the signal line, suggesting bullish momentum.
- EMA: The EMA has been steadily increasing, supporting the bullish trend.
Key Observation: The trend indicators point towards an upward movement in the stock price.
Momentum Analysis:
- RSI: The RSI has been fluctuating around the overbought territory, indicating strong buying momentum.
- Stochastic Oscillator: Both %K and %D have been in the overbought zone, signaling potential overvaluation.
- Williams %R: The Williams %R has been hovering in the oversold region, suggesting a possible reversal.
Key Observation: Momentum indicators suggest a mixed outlook with potential for a pullback due to overbought conditions.
Volatility Analysis:
- Bollinger Bands: The stock price has been trading within the bands, with the %B indicator fluctuating around 0.8, indicating high volatility.
Key Observation: Volatility remains elevated, potentially leading to sharp price movements.
Volume Analysis:
- On-Balance Volume (OBV): The OBV has shown a slight increase, indicating accumulation by investors.
- Chaikin Money Flow (CMF): The CMF has been positive, reflecting buying pressure.
Key Observation: Volume indicators suggest moderate bullish sentiment among investors.
Conclusion:
Based on the analysis of the technical indicators, the next few days may see the TPMN stock price experiencing upward momentum in the short term, supported by the bullish trend indicators. However, the overbought conditions highlighted by momentum indicators and the elevated volatility signal a potential pullback or consolidation in the near future. Investors should closely monitor the price action and consider taking profits or implementing risk management strategies to navigate the market dynamics effectively.