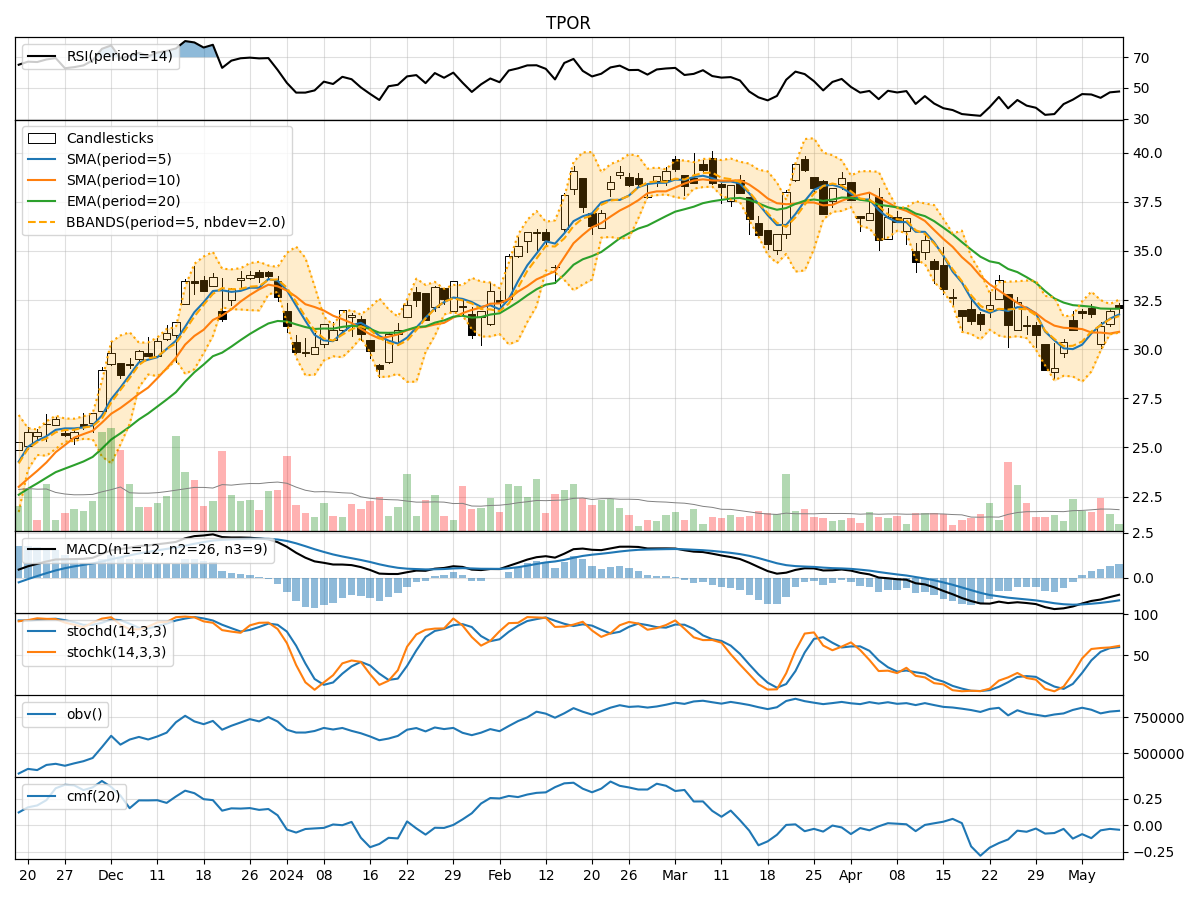
Technical Analysis of TPOR 2024-05-10
Overview:
In analyzing the technical indicators for the last 5 days of TPOR stock, we will delve into the trend, momentum, volatility, and volume indicators to provide a comprehensive outlook on the possible stock price movement in the coming days. By examining key metrics such as moving averages, MACD, RSI, Bollinger Bands, and OBV, we aim to offer valuable insights and predictions for potential price trends.
Trend Analysis:
- Moving Averages (MA): The 5-day MA has been consistently above the closing prices, indicating a short-term uptrend.
- MACD: The MACD line has been gradually improving, moving closer to the signal line, suggesting a potential bullish crossover.
- EMA: The EMA has been relatively stable, reflecting a moderate trend.
Momentum Analysis:
- RSI: The RSI values have been fluctuating around the mid-level, indicating a lack of strong momentum in either direction.
- Stochastic Oscillator: Both %K and %D have been in the overbought territory, suggesting a potential reversal or consolidation.
- Williams %R: The Williams %R values have been hovering in the oversold region, indicating a possible buying opportunity.
Volatility Analysis:
- Bollinger Bands: The stock price has been trading within the bands, with the %B indicator showing a neutral position.
- BB Width: The bands have shown slight contraction, indicating a potential decrease in volatility.
- BB %: The %B values have been relatively stable, suggesting a balanced market sentiment.
Volume Analysis:
- On-Balance Volume (OBV): The OBV has been fluctuating, indicating mixed buying and selling pressure.
- Chaikin Money Flow (CMF): The CMF values have been negative, signaling a bearish money flow trend.
Key Observations:
- The trend indicators suggest a potential bullish crossover in the short term.
- Momentum indicators show a lack of strong momentum, indicating a possible consolidation phase.
- Volatility indicators point towards a decrease in volatility and a balanced market sentiment.
- Volume indicators reflect mixed buying and selling pressure, with a bearish money flow trend.
Conclusion:
Based on the analysis of the technical indicators, the stock price of TPOR is likely to experience a period of consolidation in the coming days. While there are indications of a potential bullish crossover in the short term, the lack of strong momentum and mixed volume signals suggest a sideways movement. Traders may consider adopting a cautious approach and closely monitor key levels for potential breakout or reversal opportunities.