Technical Analysis of TPSC 2024-05-10
Overview:
In analyzing the technical indicators for TPSC over the last 5 days, we will delve into the trend, momentum, volatility, and volume indicators to provide a comprehensive outlook on the possible stock price movement in the coming days. By examining these key indicators, we aim to offer valuable insights and predictions to guide your investment decisions.
Trend Analysis:
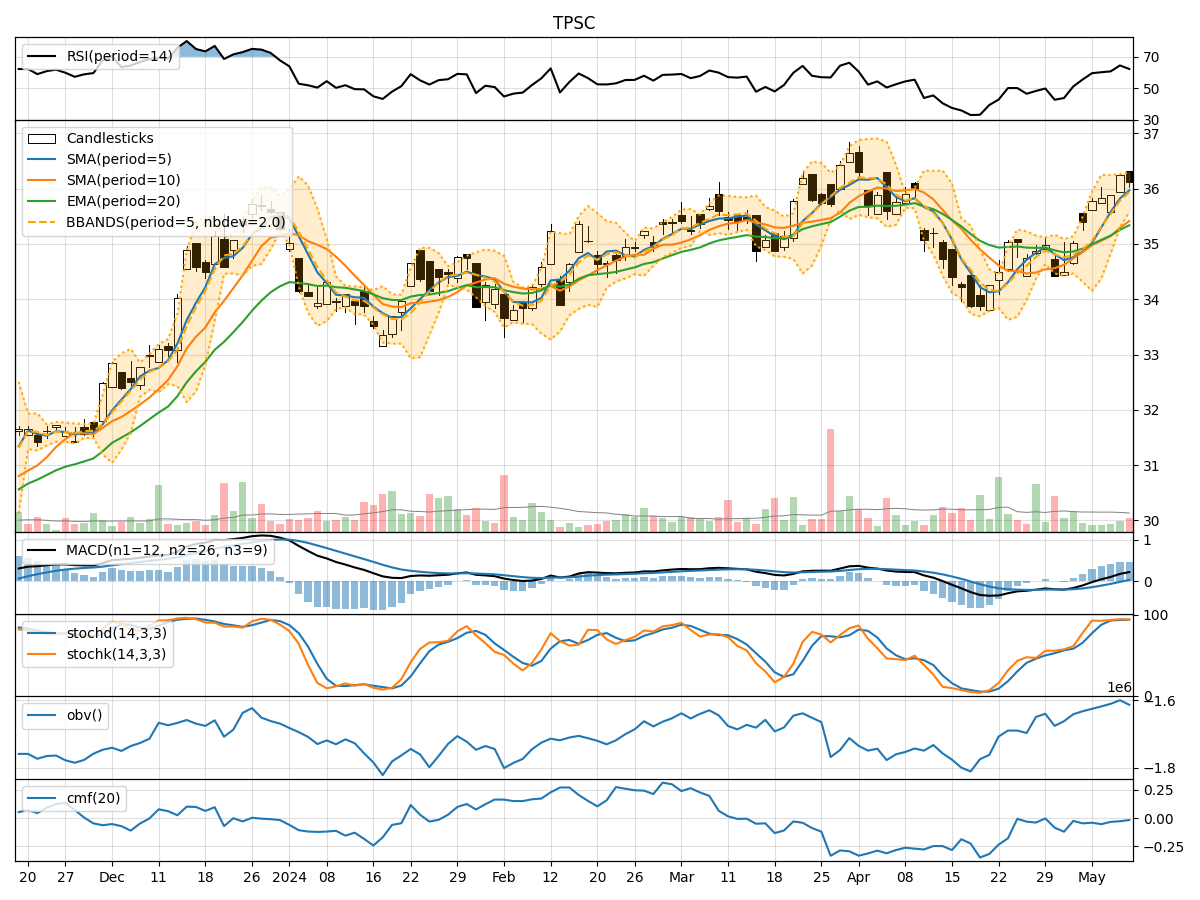
- Moving Averages (MA): The 5-day Moving Average (MA) has been consistently trending upwards, indicating a positive momentum in the stock price.
- MACD: The Moving Average Convergence Divergence (MACD) has shown an increasing trend, with the MACD line consistently above the signal line, suggesting a bullish momentum.
- EMA: The Exponential Moving Average (EMA) has also been on an upward trajectory, further supporting the bullish outlook.
Momentum Analysis:
- RSI: The Relative Strength Index (RSI) has been in the overbought territory, indicating a strong buying momentum in the stock.
- Stochastic Oscillator: Both %K and %D of the Stochastic Oscillator have been in the overbought zone, signaling a potential reversal or consolidation in the near term.
- Williams %R: The Williams %R is in the oversold region, suggesting a possible reversal or correction in the stock price.
Volatility Analysis:
- Bollinger Bands: The Bollinger Bands have been narrowing, indicating decreasing volatility in the stock price.
- Bollinger %B: The %B indicator is below 1, suggesting that the stock price is trading below the upper Bollinger Band, potentially indicating a pullback or consolidation.
Volume Analysis:
- On-Balance Volume (OBV): The OBV has shown a mixed trend, indicating indecision among investors regarding the stock.
- Chaikin Money Flow (CMF): The CMF has been negative, reflecting selling pressure in the stock.
Conclusion:
Based on the analysis of the technical indicators, the stock of TPSC is currently exhibiting bullish tendencies in terms of trend and momentum. However, the overbought conditions in the RSI and Stochastic Oscillator suggest a potential short-term correction or consolidation. The narrowing Bollinger Bands and negative CMF further support the possibility of a sideways movement in the stock price in the coming days.
Recommendation:
Considering the overall bullish trend but the overbought conditions and decreasing volatility, it is advisable to exercise caution in entering new positions at the current levels. Traders may consider taking profits on existing positions or implementing risk management strategies to navigate the potential short-term correction. Long-term investors can monitor the price action for a potential dip to accumulate or wait for a clearer trend confirmation before entering new positions.
In conclusion, while the overall outlook for TPSC remains positive, a short-term correction or consolidation phase is likely. Stay vigilant, monitor key levels, and adjust your strategy accordingly to capitalize on potential opportunities while managing risks effectively.