Technical Analysis of TRES 2024-05-10
Overview:
In analyzing the technical indicators for TRES stock over the last 5 days, we will delve into the trend, momentum, volatility, and volume indicators to provide a comprehensive outlook on the possible future stock price movement. By examining these key indicators, we aim to offer valuable insights and predictions for the upcoming trading days.
Trend Indicators:
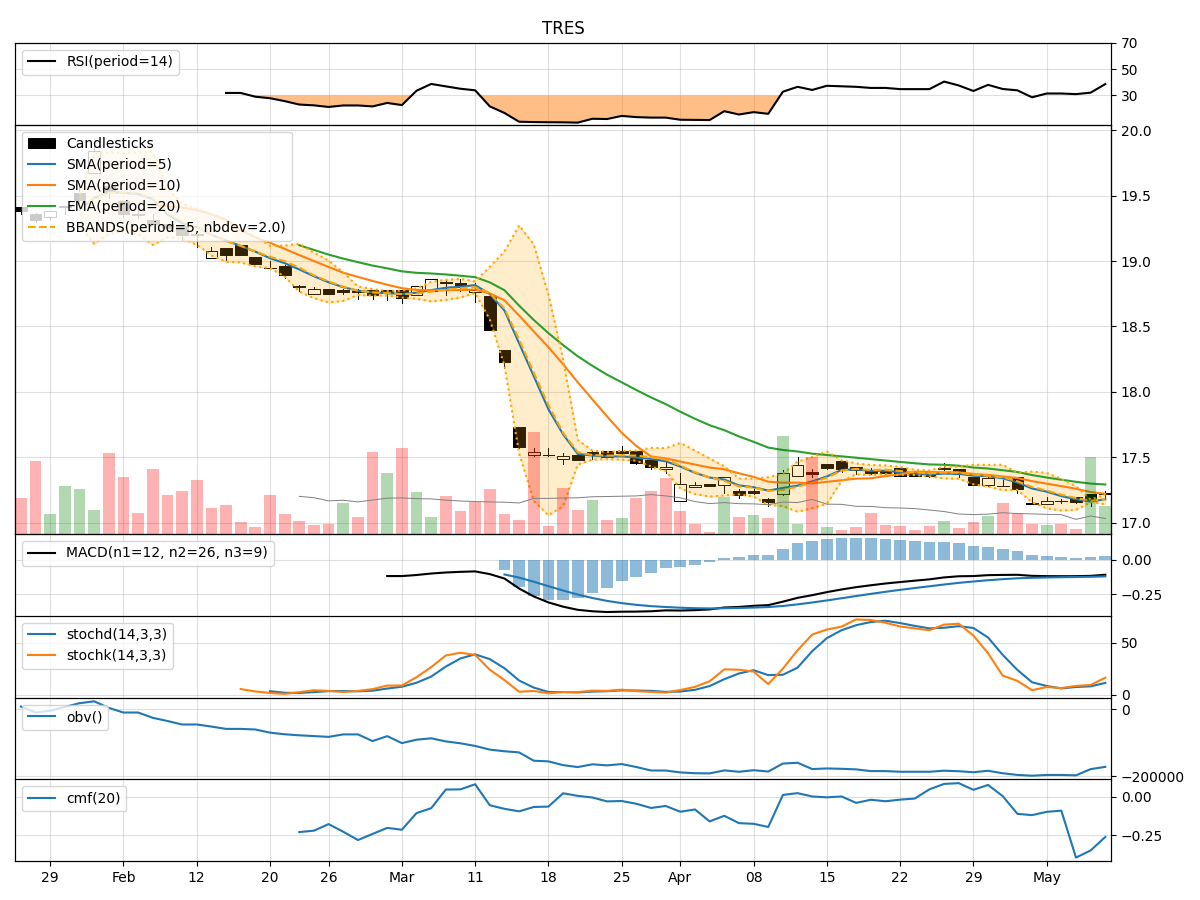
- Moving Averages (MA): The 5-day Moving Average (MA) has been consistently below the Simple Moving Average (SMA) and Exponential Moving Average (EMA) over the past 5 days, indicating a downward trend in the stock price.
- MACD: The Moving Average Convergence Divergence (MACD) has been negative, with the MACD line below the signal line, suggesting bearish momentum in the stock.
Momentum Indicators:
- RSI: The Relative Strength Index (RSI) has been relatively low, indicating oversold conditions in the stock.
- Stochastic Oscillator: Both %K and %D have been increasing, but still in the oversold territory, suggesting a potential reversal in the stock price.
Volatility Indicators:
- Bollinger Bands (BB): The stock price has been trading within the Bollinger Bands, with the bands narrowing, indicating reduced volatility in the stock.
Volume Indicators:
- On-Balance Volume (OBV): The OBV has been declining, indicating selling pressure in the stock.
- Chaikin Money Flow (CMF): The CMF has been negative, suggesting outflow of money from the stock.
Key Observations and Opinions:
- The trend indicators point towards a downward trend in the stock price, supported by the negative MACD.
- Momentum indicators show signs of oversold conditions and a potential reversal in the stock price.
- Volatility indicators indicate reduced volatility in the stock, potentially leading to a period of consolidation.
- Volume indicators suggest selling pressure and an outflow of money from the stock.
Conclusion:
Based on the analysis of the technical indicators, the next few days' possible stock price movement for TRES is likely to be sideways with a potential bullish reversal. Traders and investors should closely monitor the momentum indicators for signs of a reversal and watch for any breakouts from the current trading range. It is essential to exercise caution and wait for confirmation signals before making any trading decisions.