Technical Analysis of TRFK 2024-05-10
Overview:
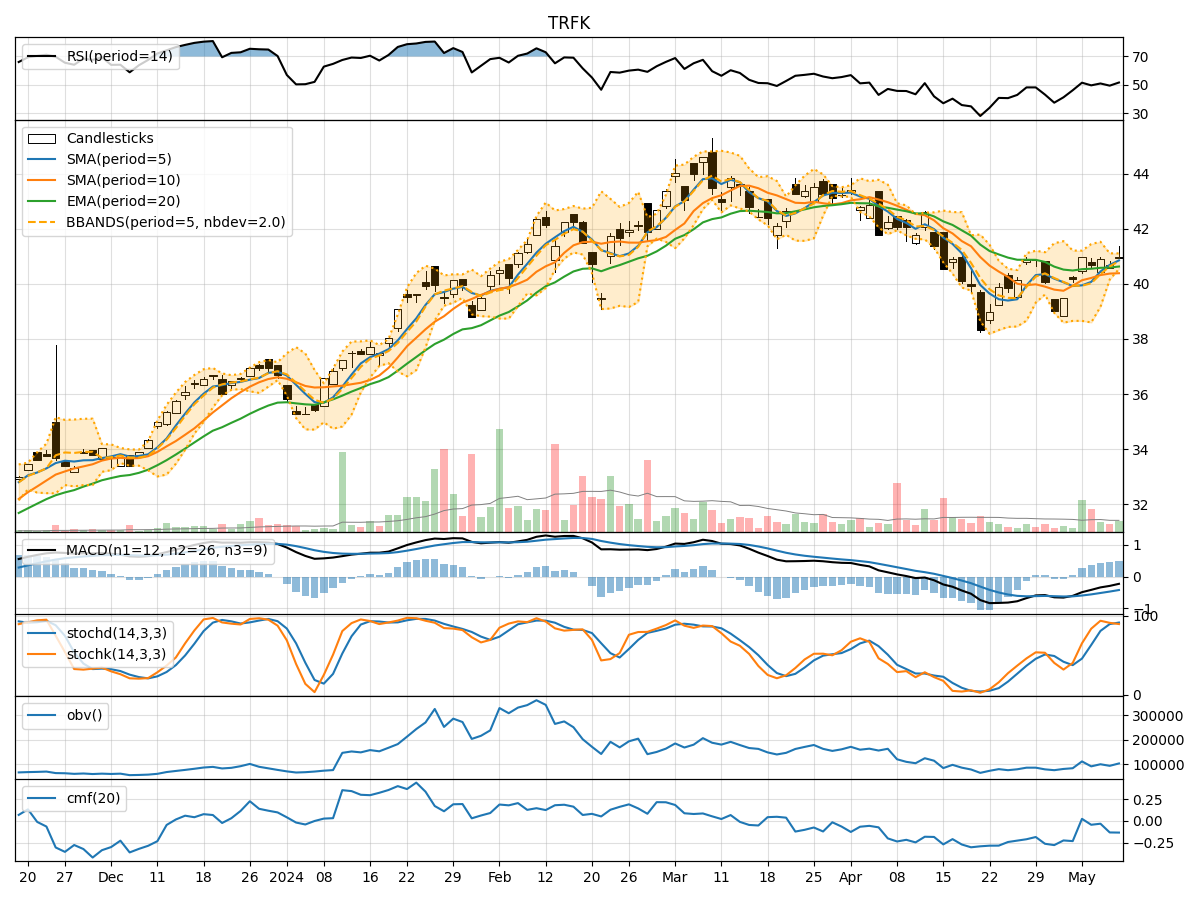
In analyzing the technical indicators for TRFK over the last 5 days, we will delve into the trend, momentum, volatility, and volume indicators to provide a comprehensive outlook on the possible stock price movement in the coming days.
Trend Indicators:
- Moving Averages (MA): The 5-day Moving Average (MA) has been trending above the Simple Moving Average (SMA) and Exponential Moving Average (EMA), indicating a short-term bullish trend.
- MACD: The Moving Average Convergence Divergence (MACD) has been negative but showing signs of convergence towards the signal line, suggesting a potential reversal in the bearish momentum.
- MACD Histogram: The MACD Histogram has been gradually decreasing, indicating a weakening bearish momentum.
Momentum Indicators:
- RSI: The Relative Strength Index (RSI) has been fluctuating around the 50 level, indicating a lack of strong momentum in either direction.
- Stochastic Oscillator: Both %K and %D of the Stochastic Oscillator have been in overbought territory, suggesting a potential reversal or consolidation phase.
- Williams %R: The Williams %R has been in oversold territory, indicating a possible reversal to the upside.
Volatility Indicators:
- Bollinger Bands (BB): The Bollinger Bands have been narrowing, indicating decreasing volatility and a potential breakout or breakdown in the near future.
- Bollinger %B: The %B indicator has been hovering around the middle range, suggesting a period of consolidation.
Volume Indicators:
- On-Balance Volume (OBV): The OBV has been declining, indicating selling pressure in the stock.
- Chaikin Money Flow (CMF): The CMF has been negative, reflecting a lack of buying interest in the stock.
Key Observations and Opinions:
- Trend: The short-term trend is bullish based on the moving averages, but the MACD signals a potential reversal.
- Momentum: The momentum indicators are mixed, with RSI indicating neutrality, Stochastic showing overbought conditions, and Williams %R in oversold territory.
- Volatility: Bollinger Bands suggest a potential breakout or breakdown due to narrowing bands, while %B indicates consolidation.
- Volume: The declining OBV and negative CMF point towards selling pressure and lack of buying interest.
Conclusion:
Based on the analysis of the technical indicators, the stock price of TRFK is likely to experience sideways consolidation in the coming days. The conflicting signals from trend, momentum, volatility, and volume indicators suggest a lack of clear direction in the near term. Traders should exercise caution and wait for a clearer trend to emerge before making significant trading decisions.