Technical Analysis of TRND 2024-05-10
Overview:
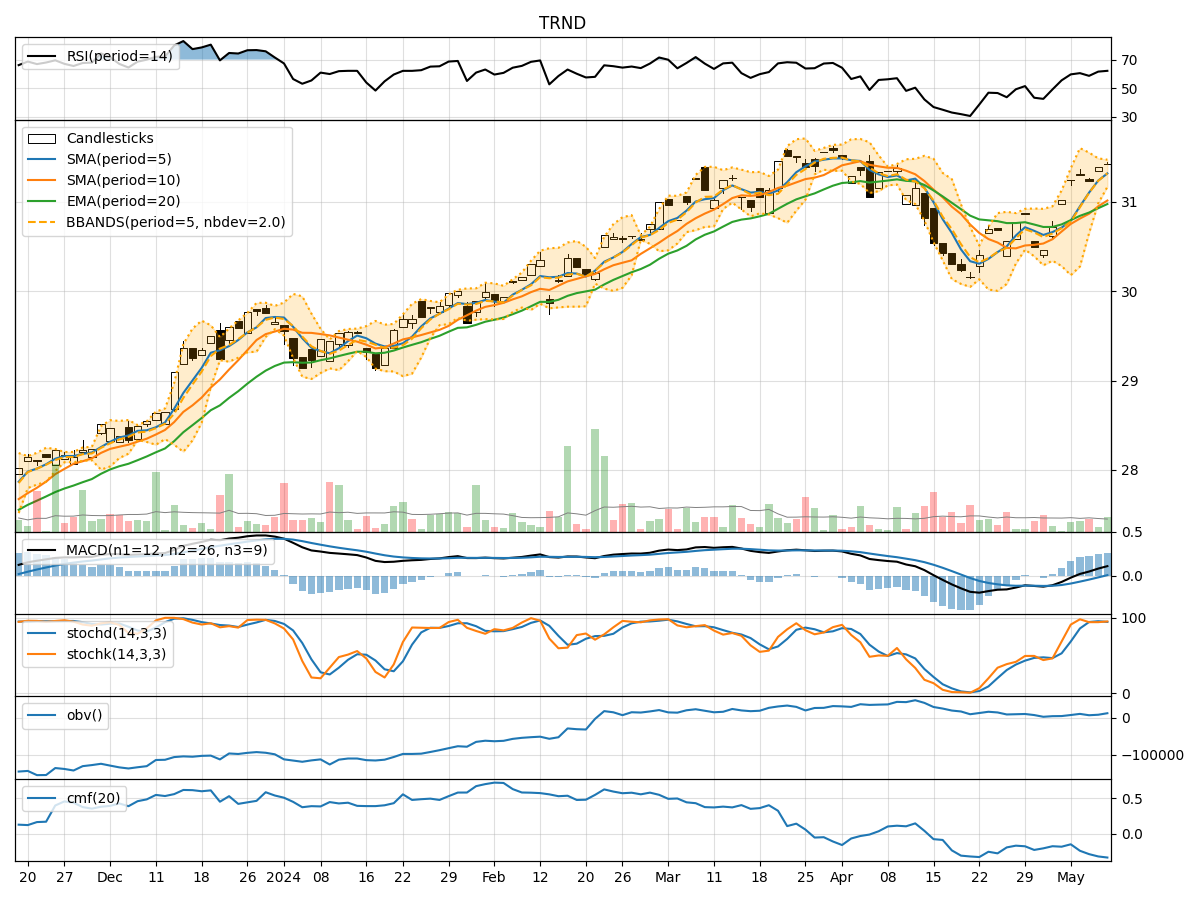
In analyzing the technical indicators for TRND over the last 5 days, we will delve into trend, momentum, volatility, and volume indicators to provide a comprehensive outlook on the possible stock price movement in the coming days. By examining these key aspects, we aim to offer valuable insights and predictions to guide your investment decisions.
Trend Analysis:
- Moving Averages (MA): The 5-day MA has been consistently above the 10-day SMA, indicating a short-term bullish trend.
- MACD: The MACD line has been consistently above the signal line, suggesting a bullish momentum.
- EMA: The EMA has been trending upwards, supporting the bullish sentiment in the short to medium term.
Momentum Analysis:
- RSI: The RSI has been fluctuating around the 60-65 range, indicating a neutral momentum.
- Stochastic Oscillator: Both %K and %D have been hovering in the overbought territory, suggesting a potential reversal or consolidation.
- Williams %R: The indicator has shown mixed signals, moving between overbought and oversold levels.
Volatility Analysis:
- Bollinger Bands (BB): The bands have been narrowing, indicating decreasing volatility and a potential breakout or significant price movement ahead.
- BB %B: The %B indicator has been fluctuating around the midline, reflecting uncertainty in price direction.
- BB Width: The narrowing width suggests a period of consolidation before a potential breakout.
Volume Analysis:
- On-Balance Volume (OBV): The OBV has shown a slight increase, indicating some accumulation by investors.
- Chaikin Money Flow (CMF): The CMF has been negative, signaling outflows and potential bearish pressure.
Conclusion:
Based on the analysis of technical indicators, the stock of TRND is likely to experience sideways consolidation in the coming days. The bullish trend indicated by moving averages and MACD may face resistance due to neutral momentum signals from RSI and stochastic oscillators. The narrowing Bollinger Bands suggest a potential breakout, but the overall uncertainty in volume indicators and negative CMF point towards a cautious approach.
Recommendation:
Considering the mixed signals from various indicators, it is advisable to wait for confirmation of a clear trend direction before making significant trading decisions. Monitoring the price action closely and waiting for a breakout above key resistance levels or a breakdown below support levels can provide better clarity for entry or exit points.
Disclaimer:
Remember that technical analysis is not a guaranteed predictor of future price movements, and other fundamental factors can influence stock prices. It is essential to conduct thorough research and consider multiple indicators before making any investment decisions. Consulting with a financial advisor can provide tailored insights based on your specific investment goals and risk tolerance level.