Technical Analysis of TSDD 2024-05-10
Overview:
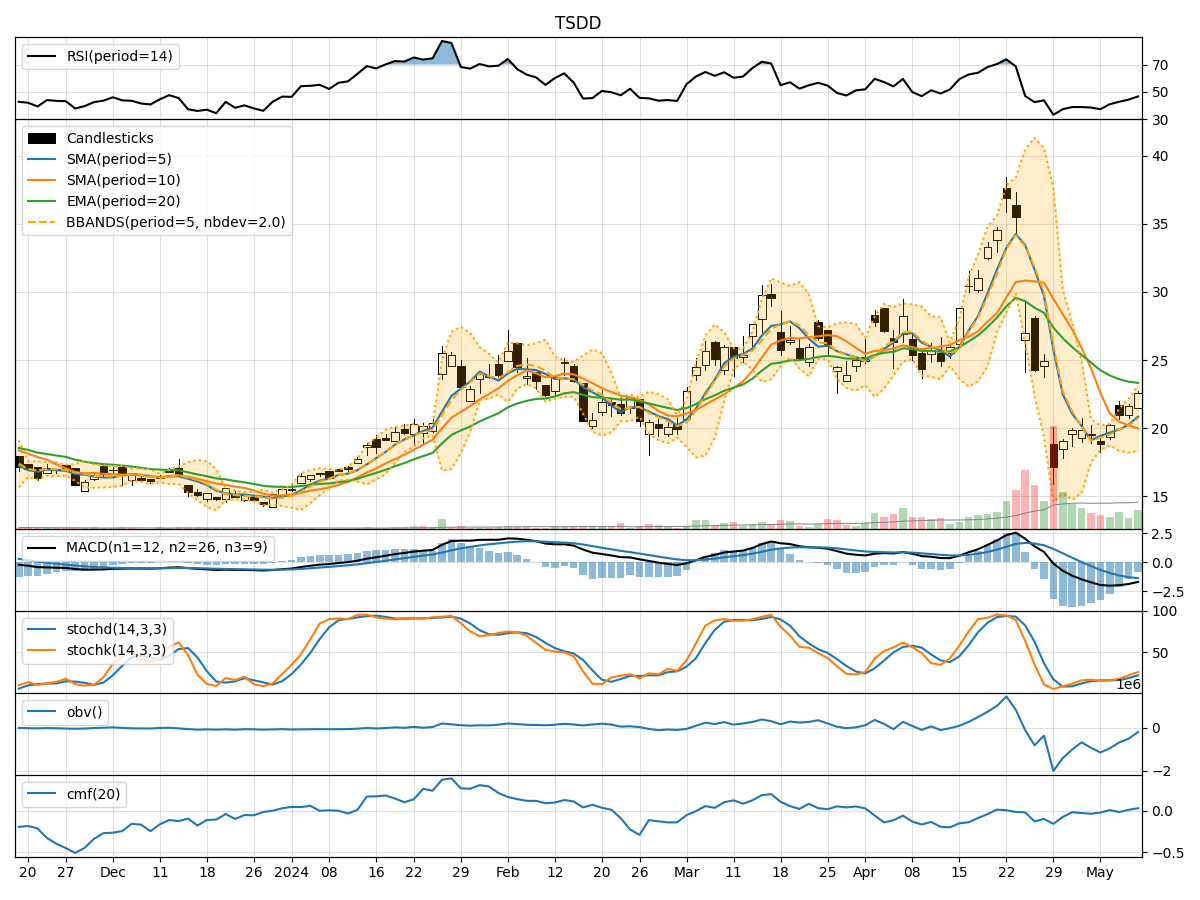
In the last 5 trading days, the stock price has shown a consistent uptrend, with each day's closing price higher than the previous day. However, there are signs of potential weakness in momentum indicators, such as RSI and Stochastic Oscillator, indicating a possible reversal or consolidation in the near future. Volatility has been increasing, as seen in the Bollinger Bands, suggesting potential price swings. Volume has been decreasing, which could indicate weakening buying interest.
Trend Indicators Analysis:
- Moving Averages (MA): The 5-day MA is below the closing price, indicating a short-term downtrend. The SMA(10) and EMA(20) are also trending downwards, suggesting a bearish sentiment.
- MACD: The MACD line is below the signal line, indicating a bearish trend. The MACD Histogram is decreasing, signaling weakening bearish momentum.
Momentum Indicators Analysis:
- RSI: The RSI is below 50 but has been increasing, indicating a potential shift towards bullish momentum. However, it is still in the oversold territory.
- Stochastic Oscillator: Both %K and %D are rising, but %K is in the overbought zone, suggesting a possible reversal.
Volatility Indicators Analysis:
- Bollinger Bands: The stock price has been touching the upper Bollinger Band, indicating overbought conditions. The widening of the bands suggests increasing volatility and potential price swings.
Volume Indicators Analysis:
- On-Balance Volume (OBV): The OBV has been declining, indicating selling pressure and potential bearish sentiment.
- Chaikin Money Flow (CMF): The CMF is positive but decreasing, suggesting weakening buying pressure.
Key Observations:
- The stock is currently in a short-term downtrend based on moving averages and MACD.
- Momentum indicators show conflicting signals, with RSI indicating a potential bullish reversal and Stochastic Oscillator suggesting overbought conditions.
- Increasing volatility as per Bollinger Bands could lead to significant price movements.
- Declining OBV and weakening CMF indicate decreasing buying interest.
Conclusion:
Based on the technical indicators and analysis: - Short-term View: The stock may experience a short-term consolidation or pullback given the conflicting signals from momentum indicators and the overbought conditions. - Medium-term View: The overall trend remains bearish, supported by moving averages and MACD. - Key Recommendation: Exercise caution and consider waiting for clearer signals before making any significant trading decisions. Monitor price action around key support and resistance levels for potential entry or exit points.
Final Verdict:
Given the current technical outlook, the next few days may see the stock price consolidating or retracing before potentially resuming its downtrend. It is crucial to closely monitor price action and key technical levels for better decision-making.