Technical Analysis of TSLH 2024-05-10
Overview:
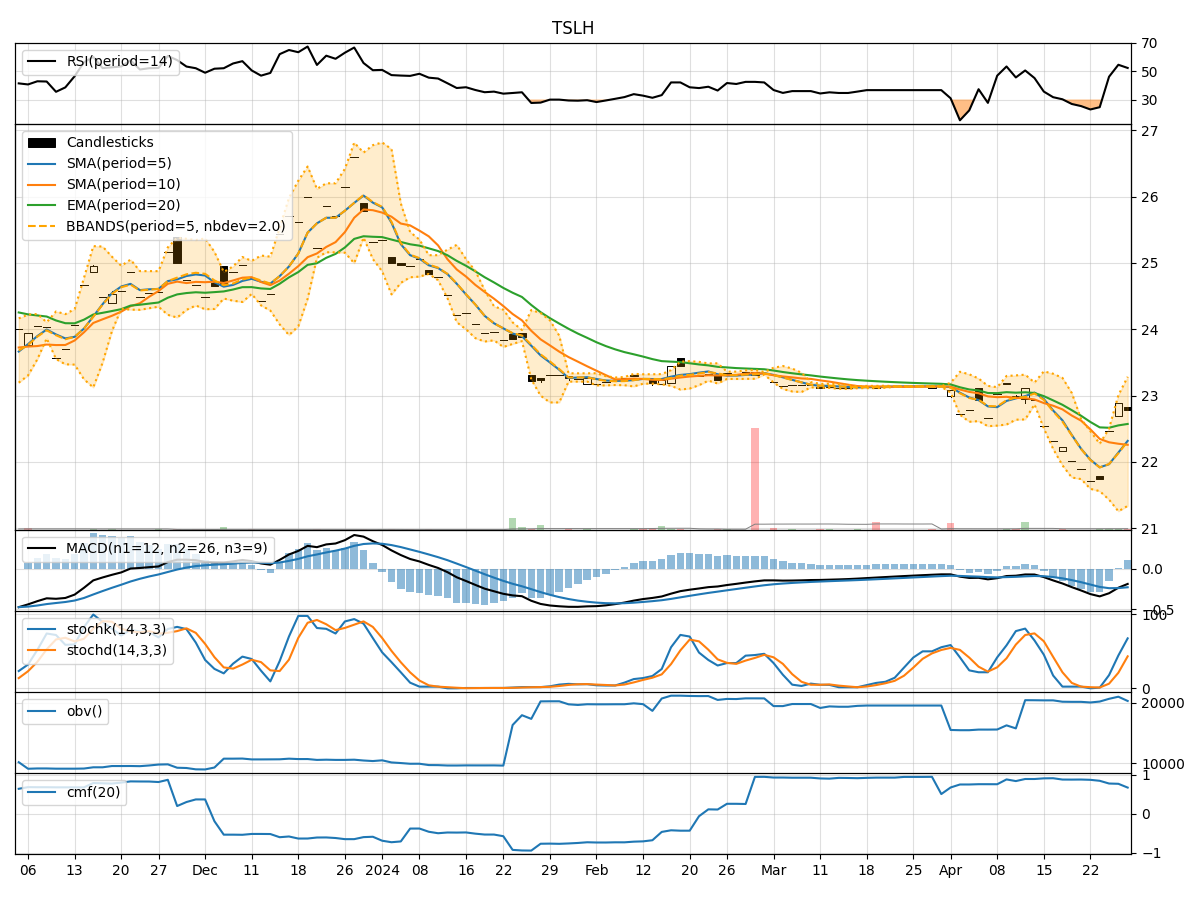
In the last 5 trading days, TSLH stock has shown a slight decline in price from 23.71 to 22.77. Various technical indicators have been analyzed to provide insights into the possible future price movement of the stock.
Trend Indicators Analysis:
- Moving Averages (MA): The 5-day MA has been slightly below the closing price, indicating a short-term bearish trend.
- MACD: The MACD line has been consistently positive, but the MACD Histogram has been decreasing, suggesting a potential weakening of the bullish momentum.
- EMA: The EMA has been relatively stable, indicating a neutral trend.
Key Observation: The trend indicators suggest a neutral to slightly bearish outlook for TSLH stock.
Momentum Indicators Analysis:
- RSI: The RSI has been gradually decreasing, indicating a weakening of the buying momentum.
- Stochastic Oscillator: Both %K and %D have been declining, suggesting a bearish momentum.
- Williams %R: The Williams %R has been in the oversold territory, indicating a potential reversal.
Key Observation: Momentum indicators point towards a bearish sentiment in the short term.
Volatility Indicators Analysis:
- Bollinger Bands: The stock price has been trading within the lower Bollinger Band, indicating oversold conditions.
- Bollinger %B: The %B value has been increasing, suggesting a potential reversal in price direction.
Key Observation: Volatility indicators signal a possible reversal or consolidation in the stock price.
Volume Indicators Analysis:
- On-Balance Volume (OBV): The OBV has been declining, indicating selling pressure in the stock.
- Chaikin Money Flow (CMF): The CMF has been negative, suggesting a bearish money flow.
Key Observation: Volume indicators support the bearish sentiment in the stock.
Conclusion:
Based on the analysis of trend, momentum, volatility, and volume indicators, the overall outlook for TSLH stock is bearish in the short term. The trend indicators show a neutral to slightly bearish trend, while momentum indicators indicate a bearish sentiment. Volatility indicators suggest a potential reversal or consolidation, and volume indicators support the bearish outlook.
Therefore, the next few days are likely to see a downward movement in TSLH stock price. Traders and investors should exercise caution and consider shorting or staying on the sidelines until a clearer trend reversal signal emerges.