Technical Analysis of TSLL 2024-05-03
Overview:
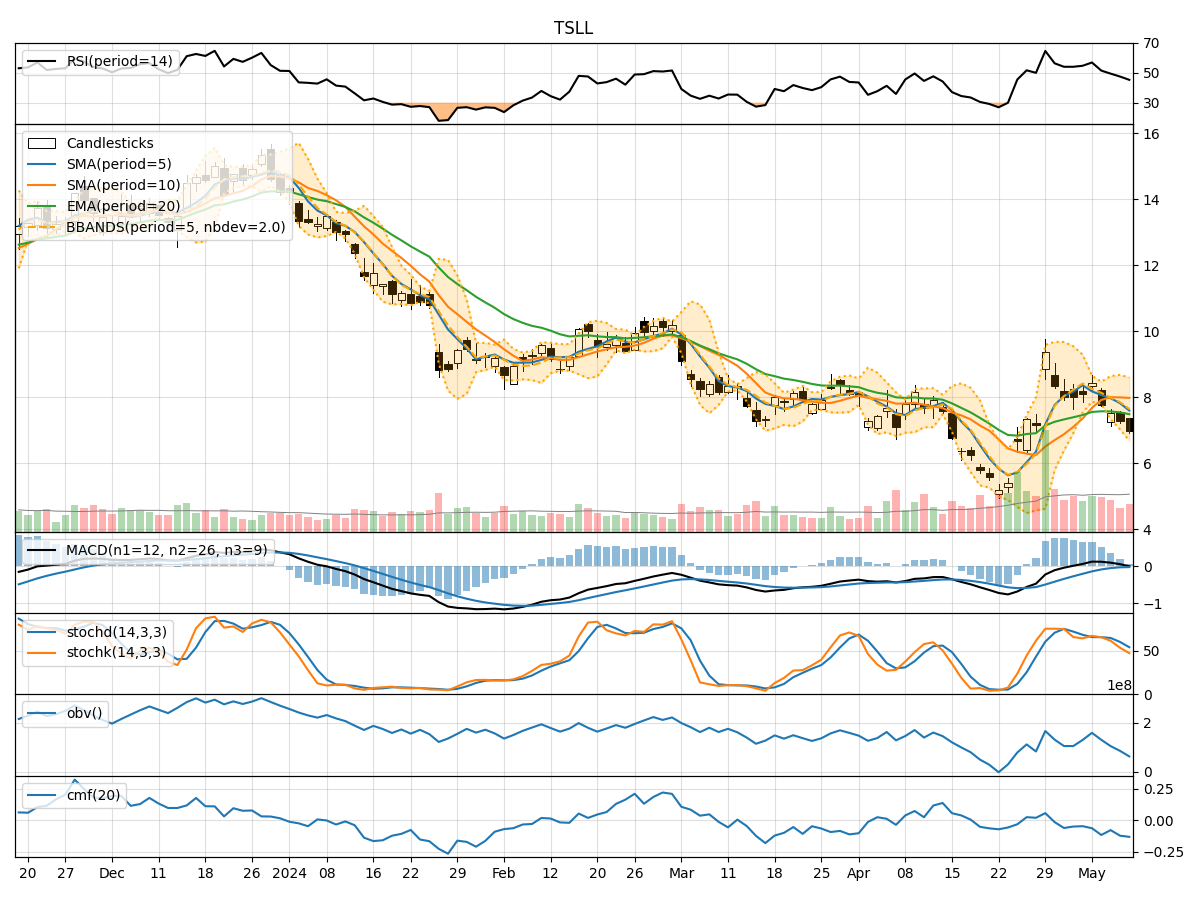
In analyzing the technical indicators for TSLL over the last 5 days, we will delve into the trend, momentum, volatility, and volume indicators to provide a comprehensive assessment of the stock's potential price movement. By examining these key aspects, we aim to offer valuable insights and predictions for the upcoming days.
Trend Analysis:
- Moving Averages (MA): The 5-day Moving Average (MA) has been consistently increasing, indicating a bullish trend in the short term.
- MACD: The MACD line has been positive, suggesting upward momentum in the stock price.
- Relative Strength Index (RSI): The RSI has been fluctuating around the neutral zone, indicating a balanced momentum.
Momentum Analysis:
- Stochastic Oscillator: The Stochastic Oscillator has been gradually decreasing, signaling a potential reversal in momentum.
- Williams %R (Willr): The Williams %R has been hovering in the oversold territory, suggesting a possible buying opportunity.
Volatility Analysis:
- Bollinger Bands (BB): The Bollinger Bands have been narrowing, indicating decreasing volatility in the stock price.
- Bollinger %B (bbp): The %B indicator has been declining, suggesting a potential consolidation phase.
Volume Analysis:
- On-Balance Volume (OBV): The OBV has shown mixed signals, with alternating positive and negative values.
- Chaikin Money Flow (CMF): The CMF has been negative, indicating selling pressure in the stock.
Key Observations:
- The trend indicators suggest a bullish sentiment in the short term.
- Momentum indicators show a potential reversal in momentum.
- Volatility indicators point towards decreasing volatility.
- Volume indicators reflect mixed signals with selling pressure.
Conclusion:
Based on the analysis of the technical indicators, the next few days' possible stock price movement for TSLL is likely to experience a consolidation phase with a slight downward bias. Traders should exercise caution and consider waiting for clearer signals before making significant trading decisions. The stock may enter a period of sideways movement before establishing a new trend direction. It is advisable to closely monitor key support and resistance levels for potential entry or exit points.
Disclaimer:
This analysis is based solely on technical indicators and historical data. Market conditions can change rapidly, and unforeseen events may impact stock prices. It is essential to conduct thorough research and consider other factors before making investment decisions. Consulting with a financial advisor is recommended to align your investment strategy with your financial goals and risk tolerance.