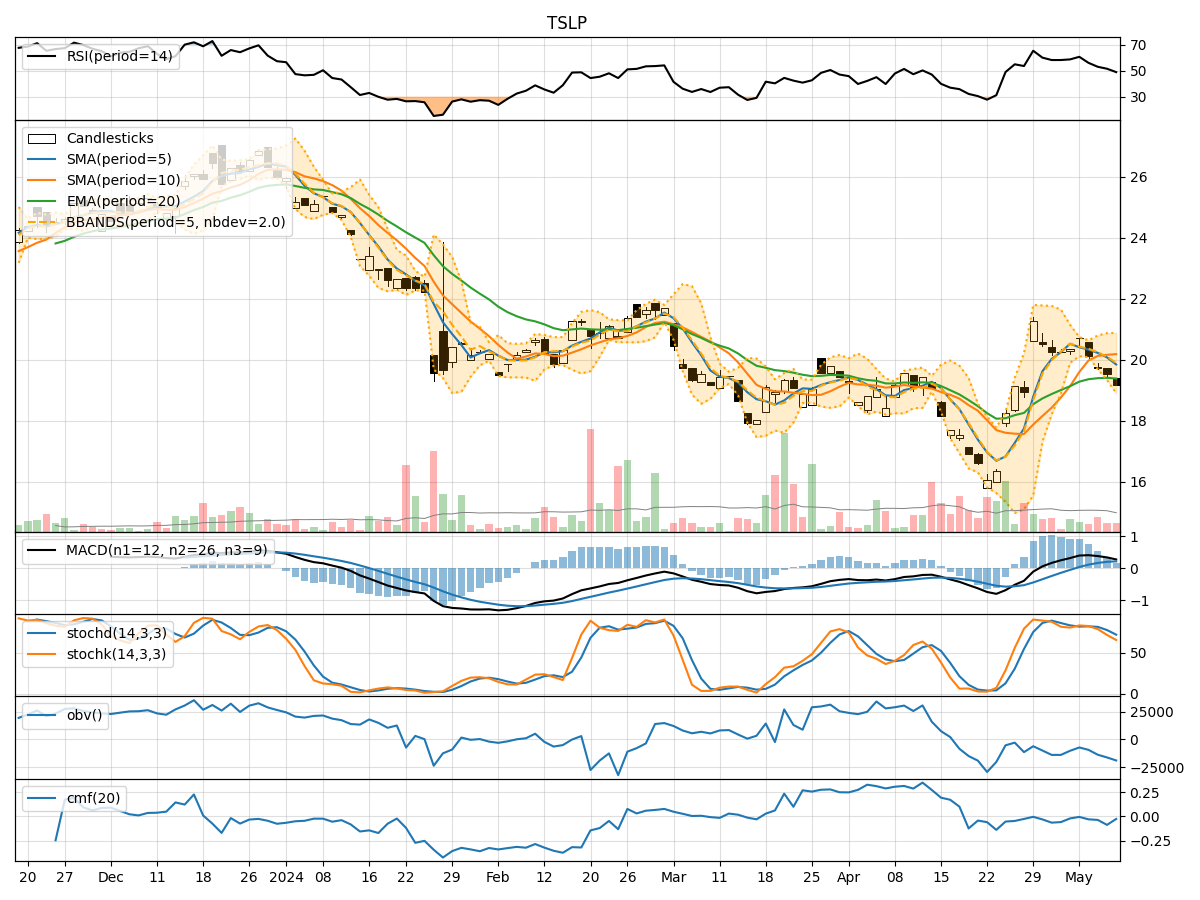
Technical Analysis of TSLP 2024-05-10
Overview:
In the last 5 trading days, TSLP stock has shown a gradual decline in price from $20.70 to $19.17. Various technical indicators have been analyzed to provide insights into the possible future price movement of the stock. The analysis covers trend indicators, momentum indicators, volatility indicators, and volume indicators.
Trend Indicators:
- Moving Averages (MA): The 5-day Moving Average (MA) has been consistently below the closing price, indicating a short-term bearish trend.
- MACD: The MACD line has been decreasing, and the MACD Histogram has been diminishing, suggesting a weakening bullish momentum.
Key Observation: The trend indicators point towards a downward trend in the stock price.
Momentum Indicators:
- RSI: The Relative Strength Index (RSI) has been declining, indicating a decrease in buying pressure.
- Stochastic Oscillator: Both %K and %D have been decreasing, showing a loss in momentum.
Key Observation: Momentum indicators suggest a bearish momentum in the stock.
Volatility Indicators:
- Bollinger Bands (BB): The Bollinger Bands have been narrowing, indicating decreasing price volatility.
Key Observation: Volatility indicators suggest a reduction in price volatility.
Volume Indicators:
- On-Balance Volume (OBV): The OBV has been consistently negative, indicating more selling volume than buying volume.
- Chaikin Money Flow (CMF): The CMF has been negative, suggesting a lack of buying pressure.
Key Observation: Volume indicators point towards higher selling volume and a lack of buying interest.
Conclusion:
Based on the analysis of the technical indicators, the next few days' possible stock price movement for TSLP is likely to be downward. The trend indicators, momentum indicators, and volume indicators all suggest a bearish outlook for the stock. The decreasing moving averages, weakening MACD, declining RSI, and negative OBV all indicate a potential continuation of the current downtrend. Additionally, the lack of buying pressure and higher selling volume further support the bearish view.
Recommendation:
Considering the overall bearish signals from the technical indicators, it would be prudent for investors to exercise caution and consider waiting for more positive signals before considering any long positions in TSLP. Short-term traders may find opportunities to capitalize on potential downward movements in the stock price. It is essential to monitor the indicators closely for any signs of a trend reversal before considering any bullish positions.