Technical Analysis of TSLQ 2024-05-10
Overview:
In analyzing the technical indicators for TSLQ over the last 5 days, we will delve into the trend, momentum, volatility, and volume indicators to provide a comprehensive outlook on the possible stock price movement in the coming days. By examining these key aspects, we aim to offer valuable insights and predictions to guide investment decisions.
Trend Indicators:
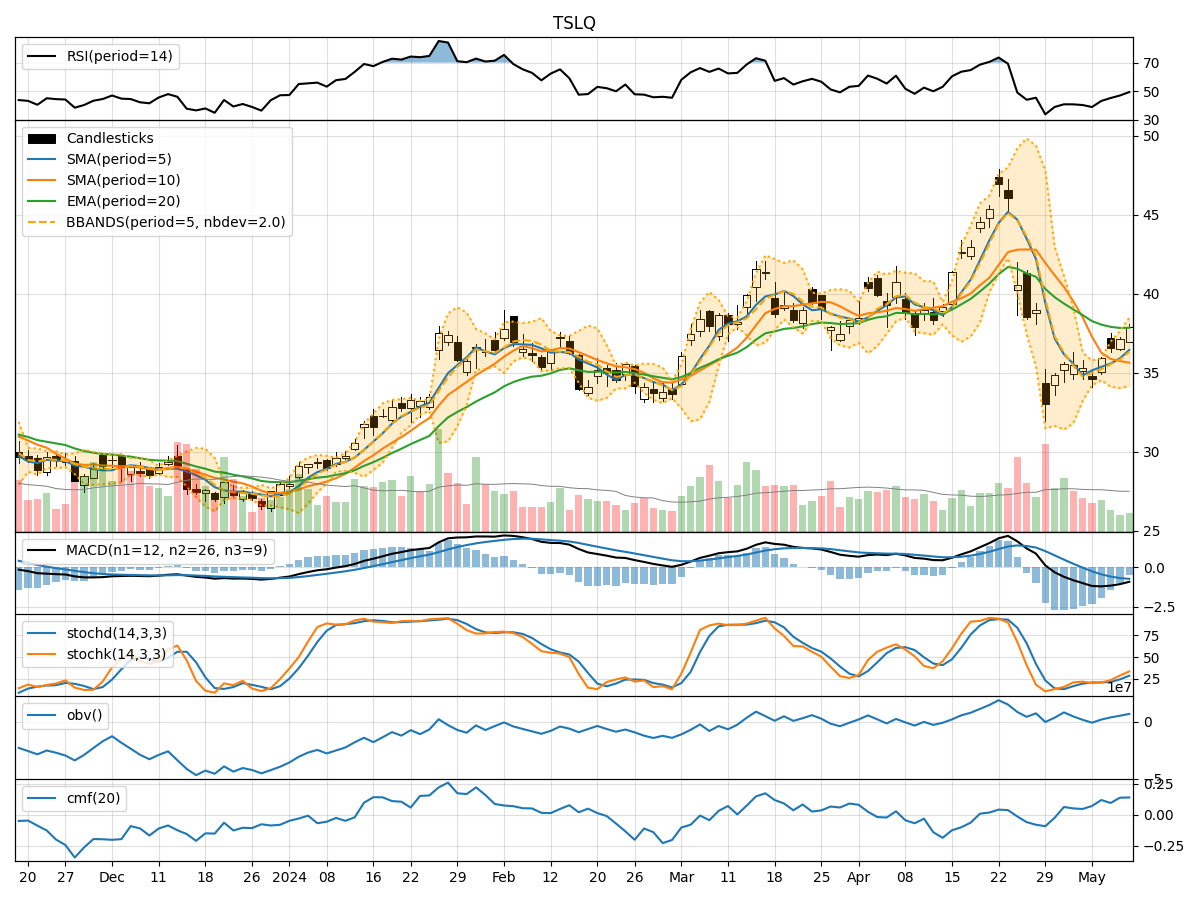
- Moving Averages (MA): The 5-day MA has been consistently below the closing prices, indicating a short-term downtrend.
- MACD: The MACD line has been negative, suggesting a bearish momentum in the stock.
- MACD Histogram: The histogram has been decreasing, signaling a weakening bearish momentum.
Momentum Indicators:
- RSI: The RSI has been gradually increasing but remains below the overbought threshold, indicating potential room for further upside.
- Stochastic Oscillator: Both %K and %D have been rising, reflecting increasing buying pressure.
- Williams %R: The indicator has been improving but still in oversold territory, suggesting a possible reversal.
Volatility Indicators:
- Bollinger Bands: The bands have been widening, indicating increased volatility in the stock price.
- Bollinger %B: The %B has been decreasing, suggesting the stock is trading closer to the lower band.
Volume Indicators:
- On-Balance Volume (OBV): The OBV has been steadily increasing, indicating accumulation by investors.
- Chaikin Money Flow (CMF): The CMF has been positive, reflecting buying pressure in the stock.
Key Observations and Opinions:
- Trend: The stock is currently in a short-term downtrend based on moving averages and MACD analysis.
- Momentum: Momentum indicators show a potential for a bullish reversal, with RSI and Stochastic Oscillator pointing towards increasing buying pressure.
- Volatility: Increasing volatility suggests potential price swings in the coming days.
- Volume: Accumulation indicated by OBV and positive CMF signal investor interest in the stock.
Conclusion:
Based on the analysis of technical indicators, the stock is showing signs of a potential bullish reversal in the coming days. The momentum indicators, particularly RSI and Stochastic Oscillator, suggest increasing buying pressure. While the trend indicators still reflect a short-term downtrend, the momentum and volume indicators point towards a possible upward movement. Traders and investors may consider buying opportunities in anticipation of a price increase. However, it is essential to monitor the price action closely and set appropriate stop-loss levels to manage risk effectively.