Technical Analysis of TSLS 2024-05-10
Overview:
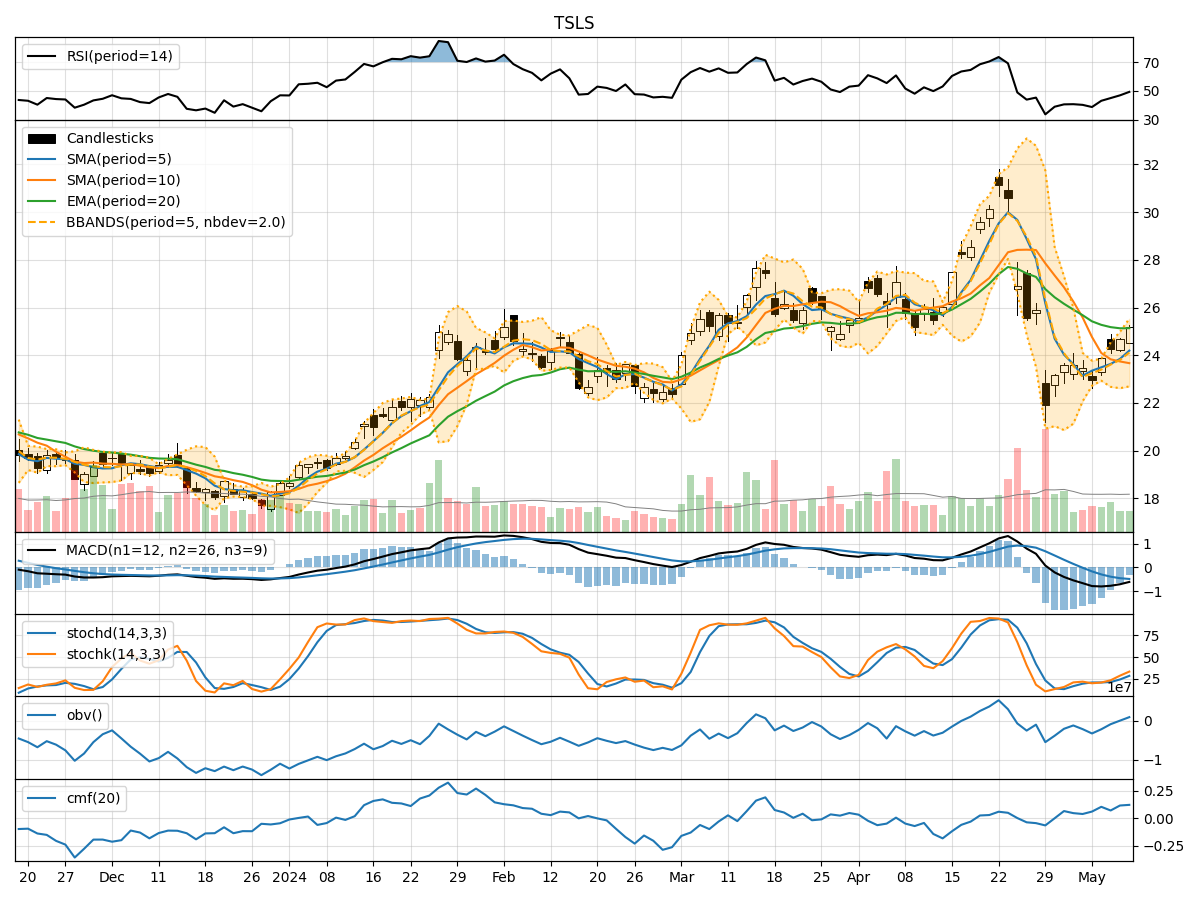
In analyzing the technical indicators for TSLS over the last 5 days, we will delve into the trend, momentum, volatility, and volume indicators to provide a comprehensive outlook on the possible stock price movement. By examining these key aspects, we aim to offer valuable insights and predictions for the upcoming days.
Trend Indicators:
- Moving Averages (MA): The 5-day MA has been showing a slight uptrend, indicating a positive momentum in the short term.
- MACD: The MACD has been consistently negative, suggesting a bearish trend in the stock price.
- EMA: The EMA has been declining, further supporting the bearish sentiment in the stock.
Momentum Indicators:
- RSI: The RSI has been gradually increasing, indicating a strengthening momentum in the stock.
- Stochastic Oscillator: Both %K and %D have been rising, signaling a bullish momentum.
- Williams %R: The indicator has been moving towards the oversold region, suggesting a potential reversal in the stock price.
Volatility Indicators:
- Bollinger Bands (BB): The bands have been widening, indicating increased volatility in the stock price.
- BB %B: The %B has been decreasing, suggesting a potential oversold condition in the stock.
Volume Indicators:
- On-Balance Volume (OBV): The OBV has been steadily increasing, indicating strong buying pressure in the stock.
- Chaikin Money Flow (CMF): The CMF has been positive, reflecting a bullish sentiment in the stock.
Key Observations and Opinions:
- Trend: The trend indicators suggest a bearish sentiment in the stock price, with the MACD and EMA pointing towards a downward trend.
- Momentum: The momentum indicators show conflicting signals, with RSI indicating a positive momentum while Williams %R suggests a potential reversal.
- Volatility: The widening Bollinger Bands indicate increased volatility, which could lead to sharp price movements.
- Volume: The rising OBV and positive CMF indicate strong buying pressure and bullish sentiment in the stock.
Conclusion:
Based on the analysis of the technical indicators, the next few days' possible stock price movement for TSLS is likely to be sideways with a slight bullish bias. While the trend indicators point towards a bearish sentiment, the momentum indicators and volume indicators suggest a potential reversal and strong buying pressure. The increased volatility could lead to sharp price movements, but overall, the stock is expected to consolidate with a slight upward bias. Investors should closely monitor key levels and wait for confirmation before making any trading decisions.