Technical Analysis of TSLZ 2024-05-10
Overview:
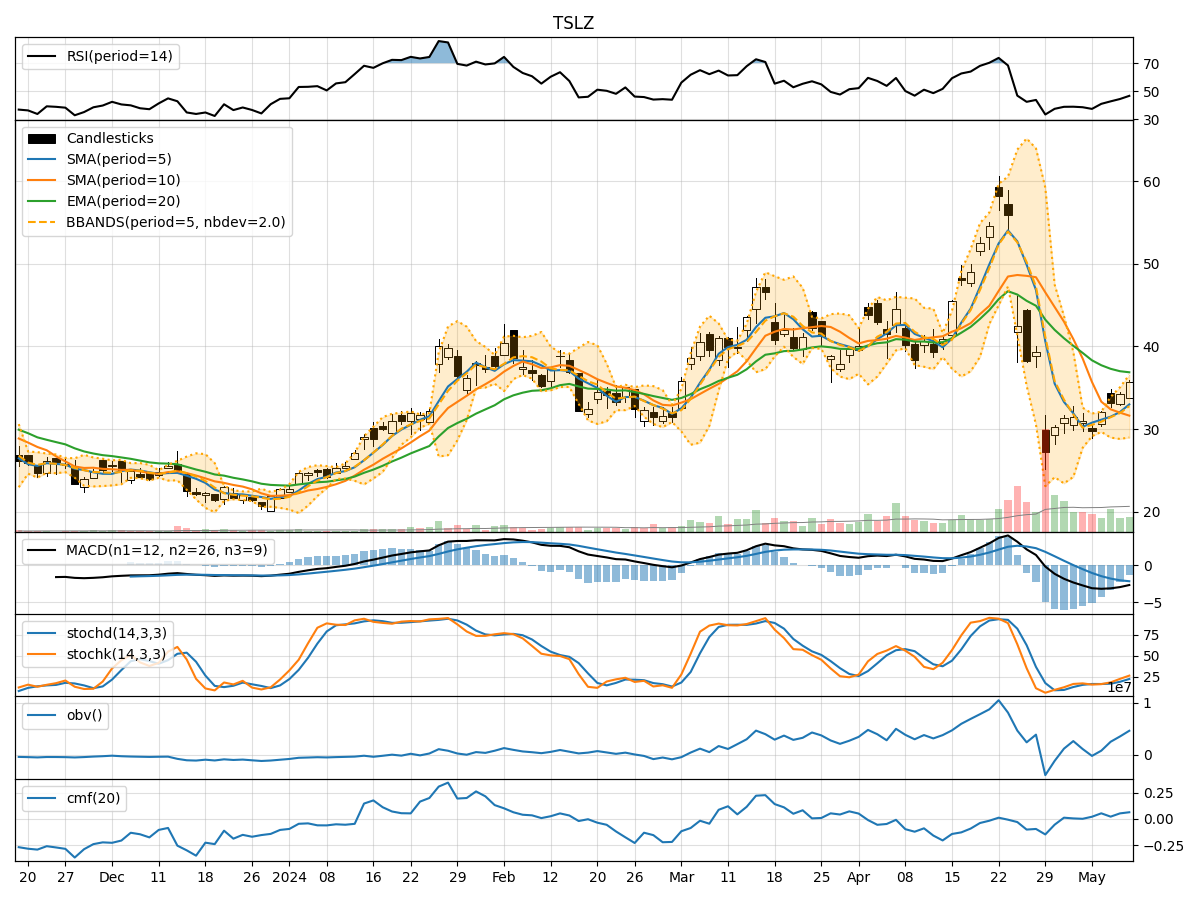
In analyzing the technical indicators for TSLZ over the last 5 days, we will delve into the trend, momentum, volatility, and volume indicators to provide a comprehensive outlook on the possible stock price movement in the coming days. By examining these key aspects, we aim to offer valuable insights and predictions to guide investment decisions.
Trend Analysis:
- Moving Averages (MA): The 5-day MA has been consistently below the closing prices, indicating a downward trend.
- MACD: The MACD line has been negative, suggesting bearish momentum in the stock.
- EMA: The EMA has been declining, further supporting the bearish trend.
Key Observation: The trend indicators point towards a downward trajectory for TSLZ.
Momentum Analysis:
- RSI: The RSI has been increasing, indicating strengthening momentum.
- Stochastic Oscillator: Both %K and %D have been rising, signaling increasing buying pressure.
- Williams %R: The indicator has been moving towards oversold levels but still has room for further downside.
Key Observation: Momentum indicators suggest a potential reversal in the current downward trend.
Volatility Analysis:
- Bollinger Bands (BB): The bands have been widening, indicating increased volatility.
- BB %B: The %B indicator has been fluctuating within the bands, reflecting volatility in price movements.
Key Observation: Volatility is on the rise, which could lead to significant price swings in the coming days.
Volume Analysis:
- On-Balance Volume (OBV): The OBV has been fluctuating, indicating mixed buying and selling pressure.
- Chaikin Money Flow (CMF): The CMF has been positive, suggesting inflow of money into the stock.
Key Observation: Volume indicators show mixed signals with no clear direction.
Conclusion:
Based on the analysis of the technical indicators, the overall outlook for TSLZ in the next few days is uncertain. While the trend indicators point towards a downward movement, the momentum indicators suggest a potential reversal in the current trend. The increasing volatility could lead to significant price swings, adding to the uncertainty. The volume indicators provide mixed signals, further complicating the prediction.
Recommendation:
Given the conflicting signals from the technical indicators, it is advisable for investors to exercise caution and closely monitor the price movements of TSLZ in the coming days. Consider setting tight stop-loss orders to manage risk effectively. Additionally, wait for more clarity in the market dynamics before making significant trading decisions.
Disclaimer:
Remember that technical analysis is not a guaranteed predictor of future price movements, and other fundamental factors and market dynamics can influence stock prices. It is essential to consider multiple indicators and conduct thorough research before making any investment decisions. Consulting with a financial advisor can provide personalized insights tailored to your specific investment goals and risk tolerance level.