Technical Analysis of TSME 2024-05-10
Overview:
In analyzing the technical indicators for TSME over the last 5 days, we will delve into the trend, momentum, volatility, and volume indicators to provide a comprehensive outlook on the possible stock price movement in the coming days. By examining these key indicators, we aim to offer valuable insights and predictions to guide your investment decisions.
Trend Indicators:
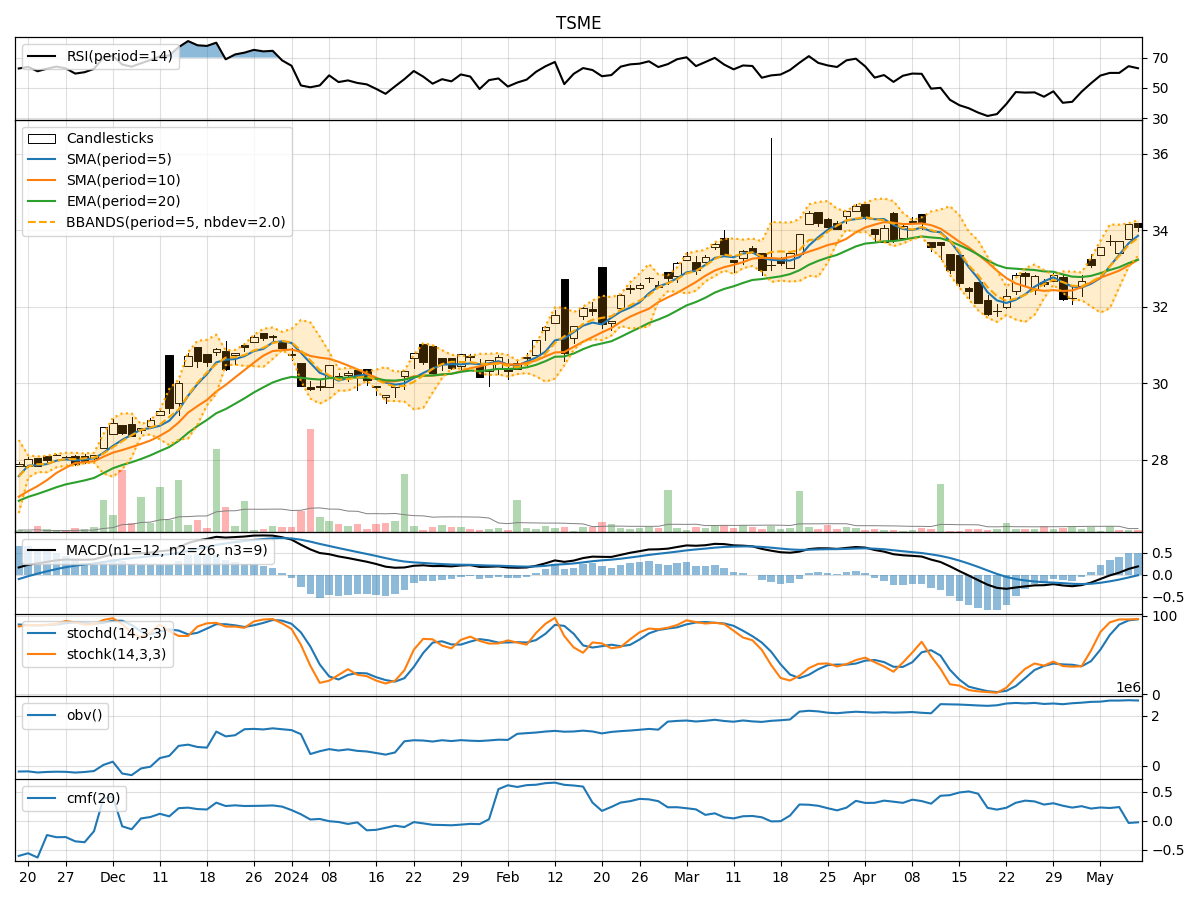
- Moving Averages (MA): The 5-day moving average has been consistently above the simple moving average (SMA) and exponential moving average (EMA), indicating a bullish trend.
- MACD: The MACD line has been consistently above the signal line, with the MACD histogram showing an increasing positive trend, suggesting bullish momentum.
Momentum Indicators:
- RSI: The Relative Strength Index (RSI) has been in the neutral to slightly overbought territory, indicating potential strength in the stock.
- Stochastic Oscillator: Both %K and %D have been in the overbought zone, suggesting a strong upward momentum.
Volatility Indicators:
- Bollinger Bands (BB): The stock price has been trading within the upper Bollinger Band, indicating an increased volatility and potential for a continuation of the current trend.
Volume Indicators:
- On-Balance Volume (OBV): The OBV has shown a slight increase, indicating accumulation of the stock by investors.
- Chaikin Money Flow (CMF): The CMF has been positive, suggesting buying pressure in the stock.
Key Observations:
- The trend indicators, momentum indicators, and volume indicators all point towards a bullish sentiment in the stock.
- The volatility indicators suggest that the stock price may continue to experience fluctuations within an upward trend.
Conclusion:
Based on the analysis of the technical indicators, the next few days' possible stock price movement for TSME is upward. The bullish trend, positive momentum, and accumulation of the stock by investors indicate a favorable outlook for potential price appreciation. Traders and investors may consider taking long positions or holding onto existing positions to capitalize on the expected upward movement in the stock price.