Technical Analysis of TTAC 2024-05-10
Overview:
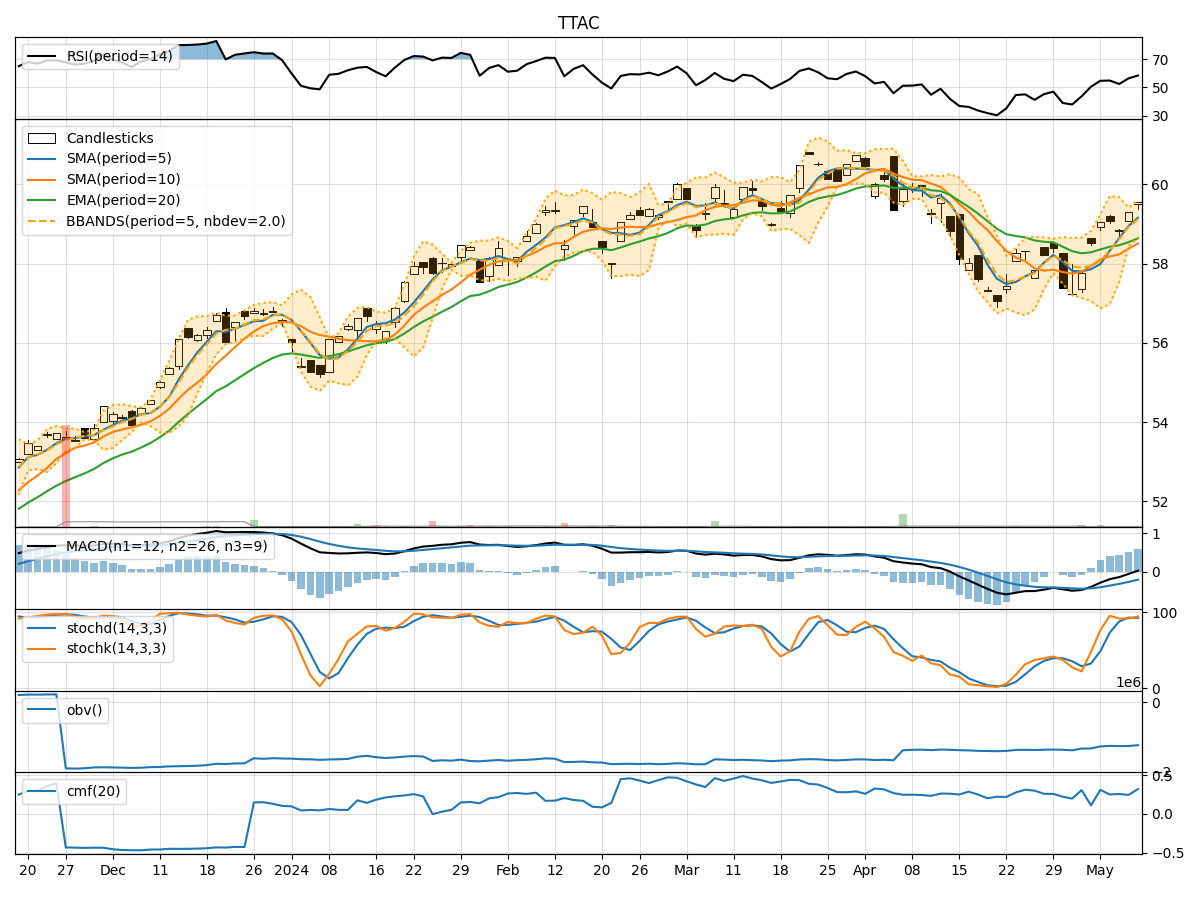
In the last 5 trading days, TTAC stock has shown mixed movements in terms of price and volume. The trend indicators suggest a slight uptrend, with moving averages and MACD showing positive signals. Momentum indicators indicate a strengthening momentum, while volatility indicators show narrowing Bollinger Bands. Volume indicators also show a positive trend in OBV and Chaikin Money Flow.
Trend Indicators:
- Moving Averages (MA): The 5-day moving average has been consistently above the longer-term moving averages, indicating a short-term uptrend.
- MACD: The MACD line has been above the signal line for the past few days, suggesting bullish momentum.
- EMA: The exponential moving average has been trending upwards, supporting the bullish sentiment.
Momentum Indicators:
- RSI: The RSI has been in the overbought territory, indicating strong buying pressure.
- Stochastic Oscillator: Both %K and %D lines are in the overbought zone, suggesting a potential reversal.
- Williams %R: The Williams %R is in the oversold region, indicating a possible buying opportunity.
Volatility Indicators:
- Bollinger Bands (BB): The Bollinger Bands have been narrowing, indicating decreasing volatility and a potential breakout.
- Bollinger %B: The %B is above 0.8, suggesting a potential overbought condition.
Volume Indicators:
- On-Balance Volume (OBV): The OBV has been trending upwards, indicating accumulation by investors.
- Chaikin Money Flow (CMF): The CMF is positive, suggesting buying pressure in the stock.
Key Observations:
- The stock is currently in an upward trend based on moving averages and MACD signals.
- Momentum indicators show overbought conditions, which might lead to a short-term correction.
- Volatility is decreasing, indicating a potential consolidation phase.
- Volume indicators support the bullish sentiment with increasing OBV and positive CMF.
Conclusion:
Based on the technical analysis of TTAC stock: - The stock is likely to experience a short-term correction due to overbought conditions in momentum indicators. - However, the overall trend remains bullish supported by moving averages and positive volume indicators. - Traders should watch for a potential breakout as Bollinger Bands narrow, indicating a possible increase in volatility. - Long-term investors can consider buying on dips during the correction phase to capitalize on the overall bullish trend.
Recommendation:
- Short-term: Consider taking profits or setting tight stop-loss orders due to overbought conditions.
- Long-term: Hold or accumulate on dips for potential upside gains in line with the overall bullish trend.
Disclaimer:
This analysis is based solely on technical indicators and historical data. Market conditions can change rapidly, and it is essential to consider other factors before making investment decisions. Consult with a financial advisor for personalized advice tailored to your risk tolerance and investment goals.