Technical Analysis of TTAI 2024-05-10
Overview:
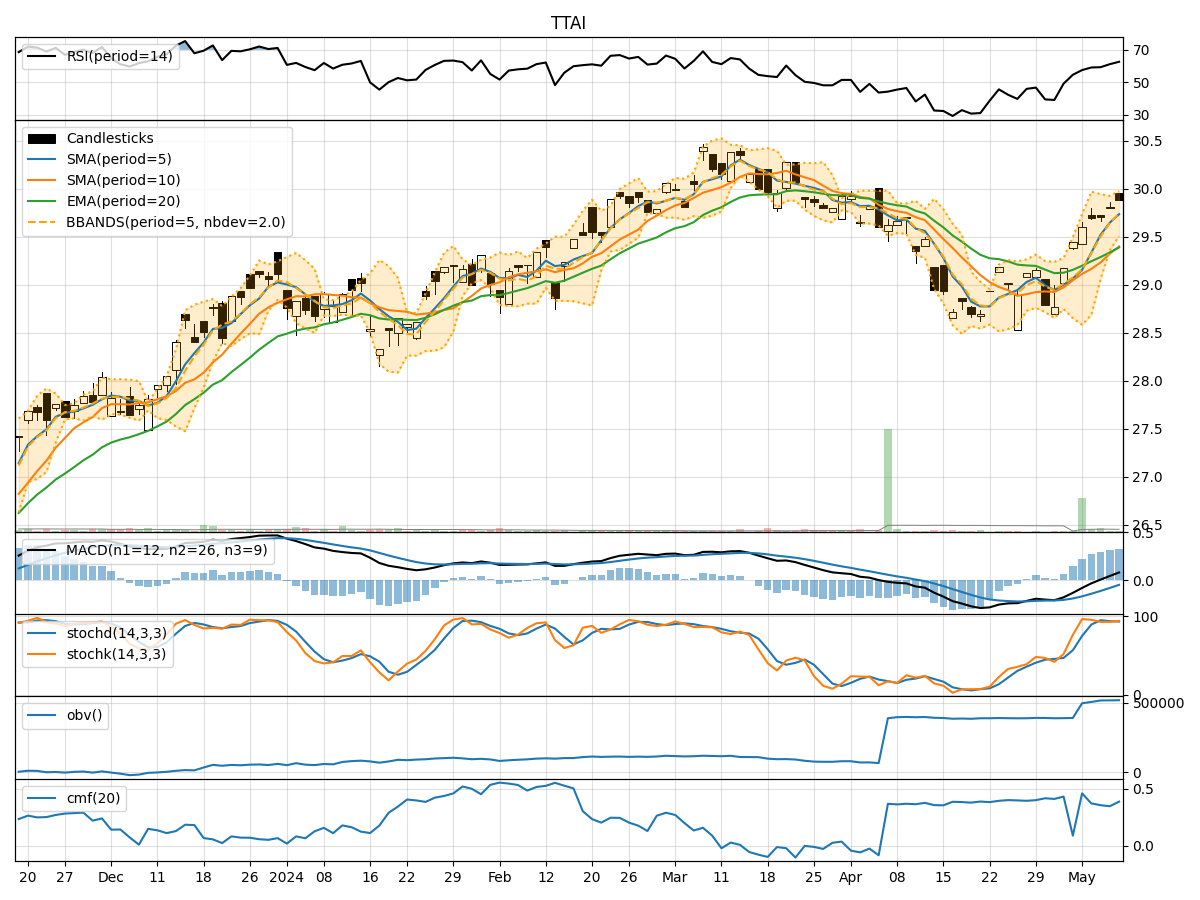
In the last 5 trading days, the stock has shown a consistent uptrend based on the trend indicators, with the moving averages and MACD signaling positive momentum. The momentum indicators also suggest a bullish sentiment, with RSI and stochastic oscillators indicating strength in the current trend. Volatility has been relatively stable, and volume indicators show a positive accumulation of volume.
Trend Indicators:
- Moving Averages (MA): The stock price has been consistently above the 5-day moving average, indicating a short-term uptrend.
- MACD: The MACD line has been consistently above the signal line, indicating bullish momentum.
- EMA: The exponential moving average has been trending upwards, supporting the bullish sentiment.
Key Observation: The trend indicators suggest a strong bullish trend in the stock price.
Momentum Indicators:
- RSI: The RSI is in the overbought territory but has been trending upwards, indicating strong buying pressure.
- Stochastic Oscillators: Both %K and %D lines are in the overbought zone, suggesting a strong uptrend.
- Williams %R: The Williams %R is also in the oversold region, indicating a potential reversal.
Key Observation: Momentum indicators confirm the bullish sentiment, but caution is advised due to the overbought conditions.
Volatility Indicators:
- Bollinger Bands: The stock price has been trading within the upper Bollinger Band, indicating a potential overbought condition.
- Bollinger %B: The %B is above 0.8, suggesting a high price relative to the bands.
- Average True Range (ATR): The ATR has been relatively stable, indicating consistent volatility levels.
Key Observation: Volatility indicators suggest a potential overbought condition, which could lead to a price correction.
Volume Indicators:
- On-Balance Volume (OBV): The OBV has been steadily increasing, indicating strong buying pressure.
- Chaikin Money Flow (CMF): The CMF is positive, suggesting a bullish accumulation of volume.
Key Observation: Volume indicators support the bullish trend, indicating strong buying interest in the stock.
Conclusion:
Based on the analysis of the technical indicators, the stock is currently in a strong bullish trend with positive momentum and volume accumulation. However, caution is advised as some indicators are showing overbought conditions. The stock price may experience a short-term correction or consolidation before potentially resuming its uptrend. Traders should closely monitor the price action and key support levels for potential entry or exit points.
Recommendation:
- Short-term Traders: Consider taking profits or tightening stop-loss levels due to overbought conditions.
- Long-term Investors: Hold positions but be prepared for potential short-term volatility.
- New Investors: Wait for a potential pullback to enter at a more favorable price level.
Always remember to conduct your own research and consider multiple factors before making any investment decisions.