Technical Analysis of TUGN 2024-05-10
Overview:
In analyzing the technical indicators for TUGN over the last 5 days, we will delve into the trend, momentum, volatility, and volume indicators to provide a comprehensive assessment of the stock's potential price movement. By examining these key factors, we aim to offer valuable insights and predictions for the next few days.
Trend Analysis:
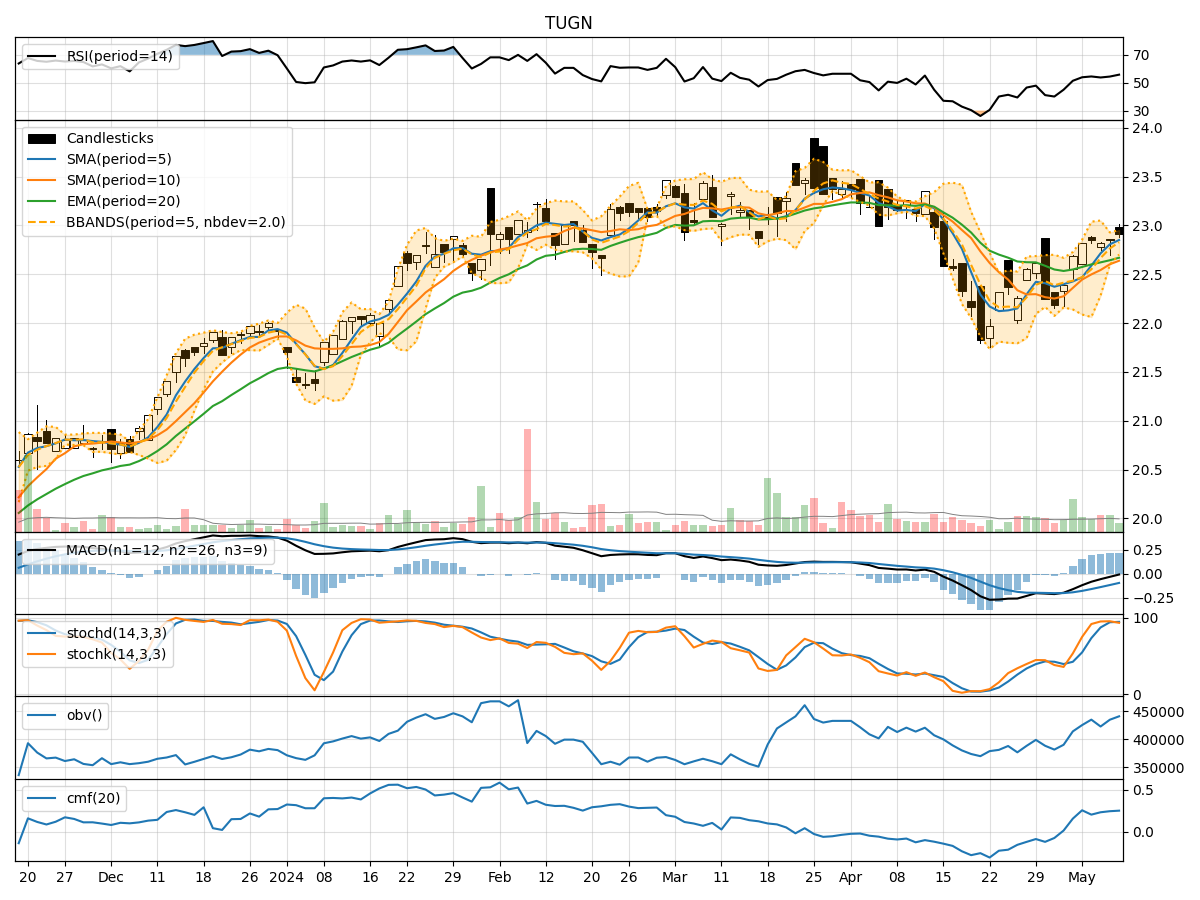
- Moving Averages (MA): The 5-day Moving Average (MA) has been consistently above the Simple Moving Average (SMA) and Exponential Moving Average (EMA) over the past 5 days, indicating a bullish trend.
- MACD: The MACD line has been gradually increasing, with the MACD histogram also showing positive values, suggesting bullish momentum in the stock price.
- Conclusion: The trend indicators point towards a bullish outlook for TUGN in the upcoming days.
Momentum Analysis:
- RSI: The Relative Strength Index (RSI) has been fluctuating around the mid-level, indicating neutral momentum in the stock.
- Stochastic Oscillator: Both %K and %D values have been relatively high, suggesting overbought conditions in the stock.
- Conclusion: The momentum indicators signal a neutral to slightly bearish momentum for TUGN.
Volatility Analysis:
- Bollinger Bands (BB): The stock price has been trading within the Bollinger Bands, with the bands narrowing, indicating decreasing volatility.
- Conclusion: Volatility indicators suggest a consolidation phase for TUGN, with the stock likely to trade within a tight range in the near future.
Volume Analysis:
- On-Balance Volume (OBV): The OBV has shown a slight increase over the last 5 days, indicating positive buying pressure in the stock.
- Chaikin Money Flow (CMF): The CMF has been positive, reflecting inflow of money into the stock.
- Conclusion: Volume indicators suggest positive sentiment among investors towards TUGN.
Conclusion:
Based on the analysis of trend, momentum, volatility, and volume indicators, the overall outlook for TUGN in the next few days is as follows: - Trend: Upward trend with bullish signals. - Momentum: Neutral to slightly bearish momentum. - Volatility: Consolidation phase with decreasing volatility. - Volume: Positive buying pressure and inflow of money into the stock.
Final Recommendation:
Considering the overall analysis, it is likely that TUGN will experience upward movement in the next few days, supported by the bullish trend and positive volume indicators. However, investors should be cautious of the neutral to slightly bearish momentum and the consolidation phase in volatility. It is advisable to monitor the stock closely for any potential shifts in market dynamics.