Technical Analysis of TUR 2024-05-10
Overview:
In analyzing the technical indicators for TUR stock over the last 5 days, we will delve into the trend, momentum, volatility, and volume indicators to provide a comprehensive outlook on the possible stock price movement in the coming days. By examining these key aspects, we aim to offer valuable insights and recommendations for potential investors.
Trend Analysis:
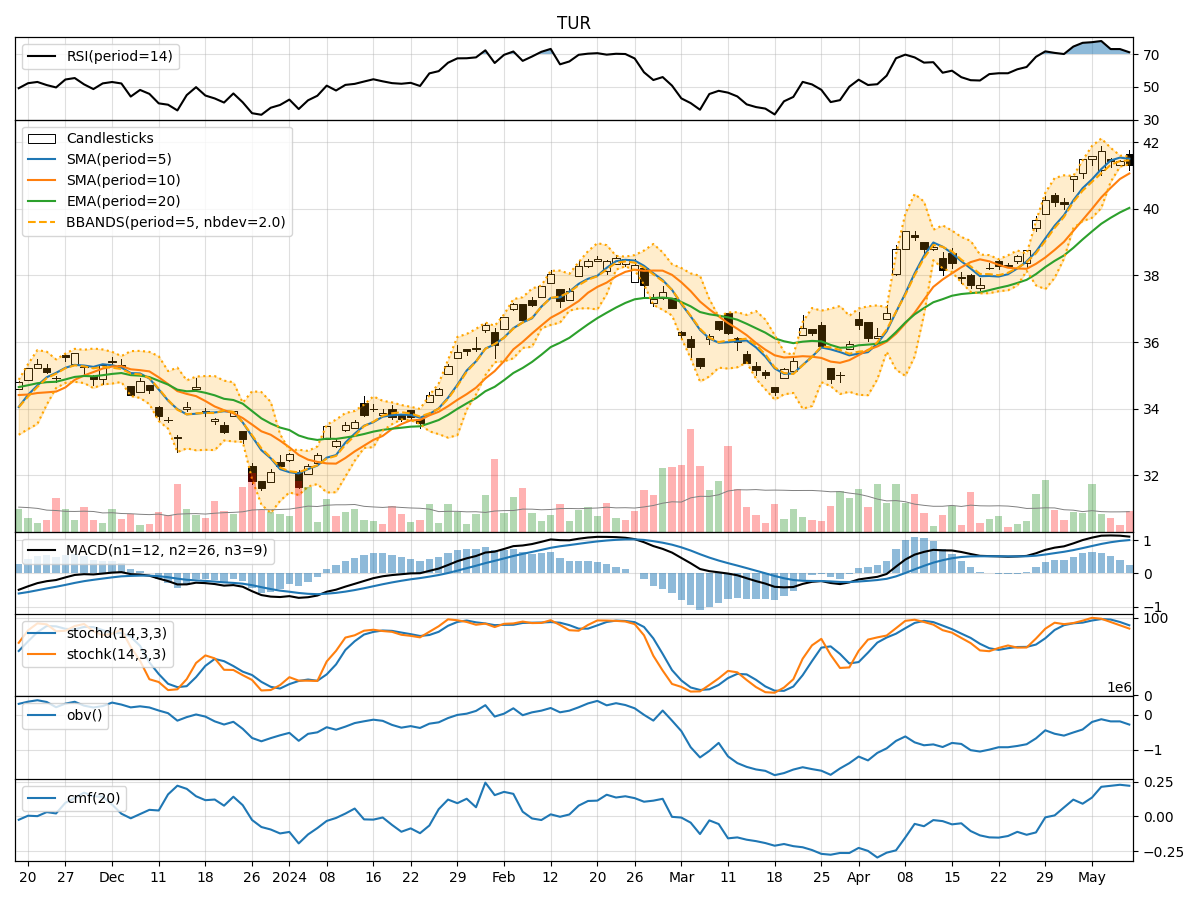
- Moving Averages (MA): The 5-day Moving Average (MA) has been consistently above the Simple Moving Average (SMA) and Exponential Moving Average (EMA), indicating a bullish trend.
- MACD: The MACD line has been above the signal line, with both lines showing an upward trend, suggesting bullish momentum.
Momentum Analysis:
- RSI: The Relative Strength Index (RSI) has been in the overbought territory, indicating a strong bullish momentum.
- Stochastic Oscillator: Both %K and %D have been decreasing but remain in the overbought zone, suggesting a potential reversal or consolidation.
Volatility Analysis:
- Bollinger Bands (BB): The stock price has been trading within the upper Bollinger Band, indicating an overbought condition.
Volume Analysis:
- On-Balance Volume (OBV): The OBV has been fluctuating, indicating indecision among investors.
- Chaikin Money Flow (CMF): The CMF has been positive, suggesting buying pressure in the market.
Key Observations:
- The trend indicators suggest a strong bullish sentiment in the short term.
- Momentum indicators show signs of potential reversal or consolidation due to overbought conditions.
- Volatility indicators point towards an overbought market, potentially leading to a price correction.
- Volume indicators reflect mixed signals, indicating uncertainty among market participants.
Conclusion:
Based on the analysis of the technical indicators, the next few days' possible stock price movement for TUR is likely to experience a short-term correction or consolidation. The bullish trend may face resistance due to overbought conditions and the potential for profit-taking by investors. Traders should exercise caution and consider waiting for a clearer signal before entering new positions.