Technical Analysis of TVAL 2024-05-10
Overview:
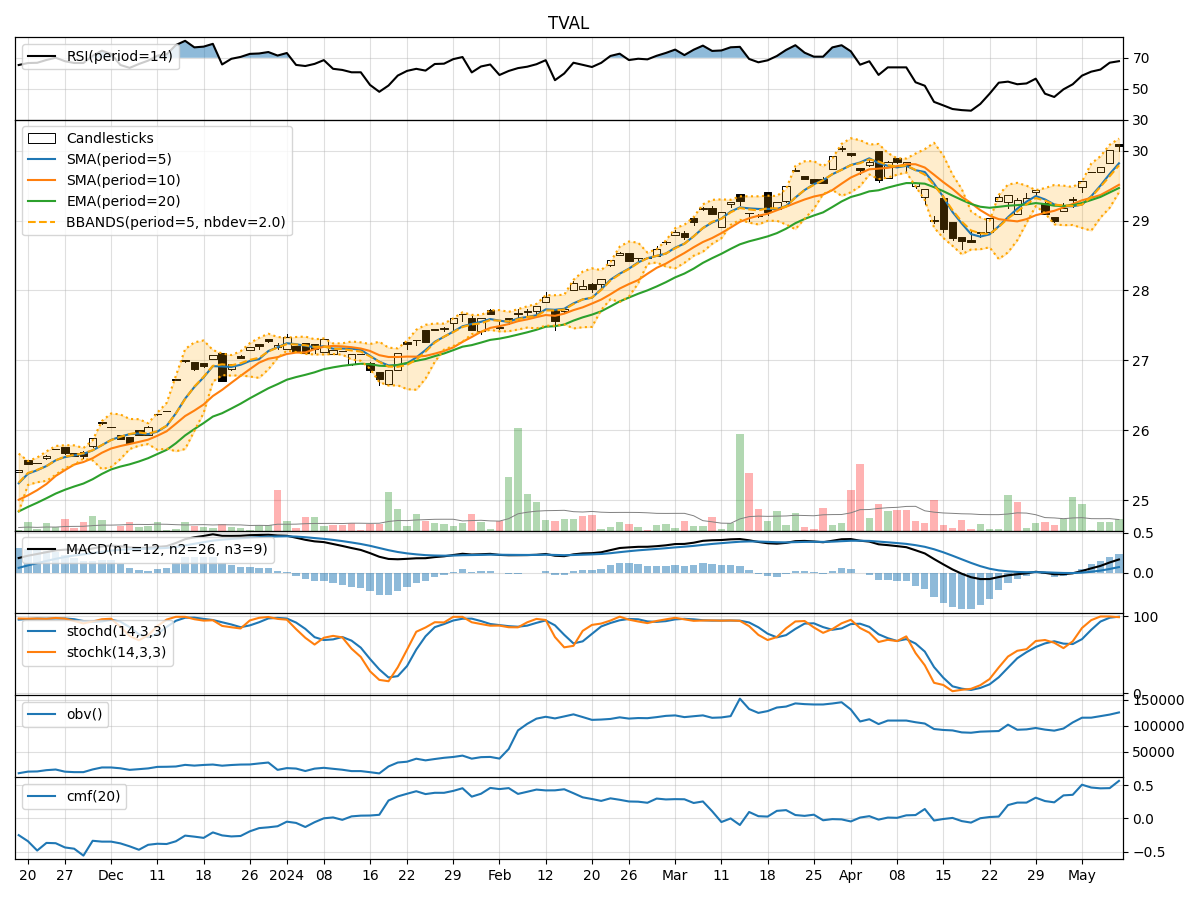
In analyzing the technical indicators for TVAL stock over the last 5 days, we will delve into the trend, momentum, volatility, and volume indicators to provide a comprehensive outlook on the possible stock price movement in the coming days.
Trend Indicators:
- Moving Averages (MA): The 5-day Moving Average has been consistently above the Simple Moving Average (SMA) and Exponential Moving Average (EMA), indicating a bullish trend.
- MACD: The MACD line has been above the signal line, with both lines showing an upward trend, suggesting bullish momentum.
- MACD Histogram: The MACD Histogram has been increasing, indicating strengthening bullish momentum.
Momentum Indicators:
- RSI: The Relative Strength Index (RSI) has been trending upwards, reaching levels above 50, indicating increasing buying pressure.
- Stochastic Oscillator: Both %K and %D lines of the Stochastic Oscillator have been in the overbought zone, suggesting a strong bullish momentum.
- Williams %R: The Williams %R has been in the oversold zone, indicating a potential reversal to the upside.
Volatility Indicators:
- Bollinger Bands: The stock price has been trading within the Bollinger Bands, with the bands widening slightly, indicating increased volatility.
- Bollinger %B: The %B indicator has been fluctuating around 0.8, suggesting the stock is trading near the upper band.
Volume Indicators:
- On-Balance Volume (OBV): The OBV has been trending upwards, indicating accumulation by investors.
- Chaikin Money Flow (CMF): The CMF has been positive, indicating buying pressure in the stock.
Key Observations and Opinions:
- Trend: The stock is in a strong bullish trend based on moving averages and MACD indicators.
- Momentum: Momentum indicators suggest a strong bullish sentiment with potential for a continuation of the uptrend.
- Volatility: The slight increase in volatility could lead to larger price movements in the coming days.
- Volume: Increasing OBV and positive CMF indicate strong buying interest in the stock.
Conclusion:
Based on the analysis of the technical indicators, the next few days' possible stock price movement for TVAL is likely to be upward. The bullish trend, strong momentum, positive volume flow, and slightly increased volatility all point towards a continuation of the current uptrend. Traders and investors may consider buying opportunities in TVAL stock for potential gains in the near term.