Technical Analysis of TWIO 2024-05-10
Overview:
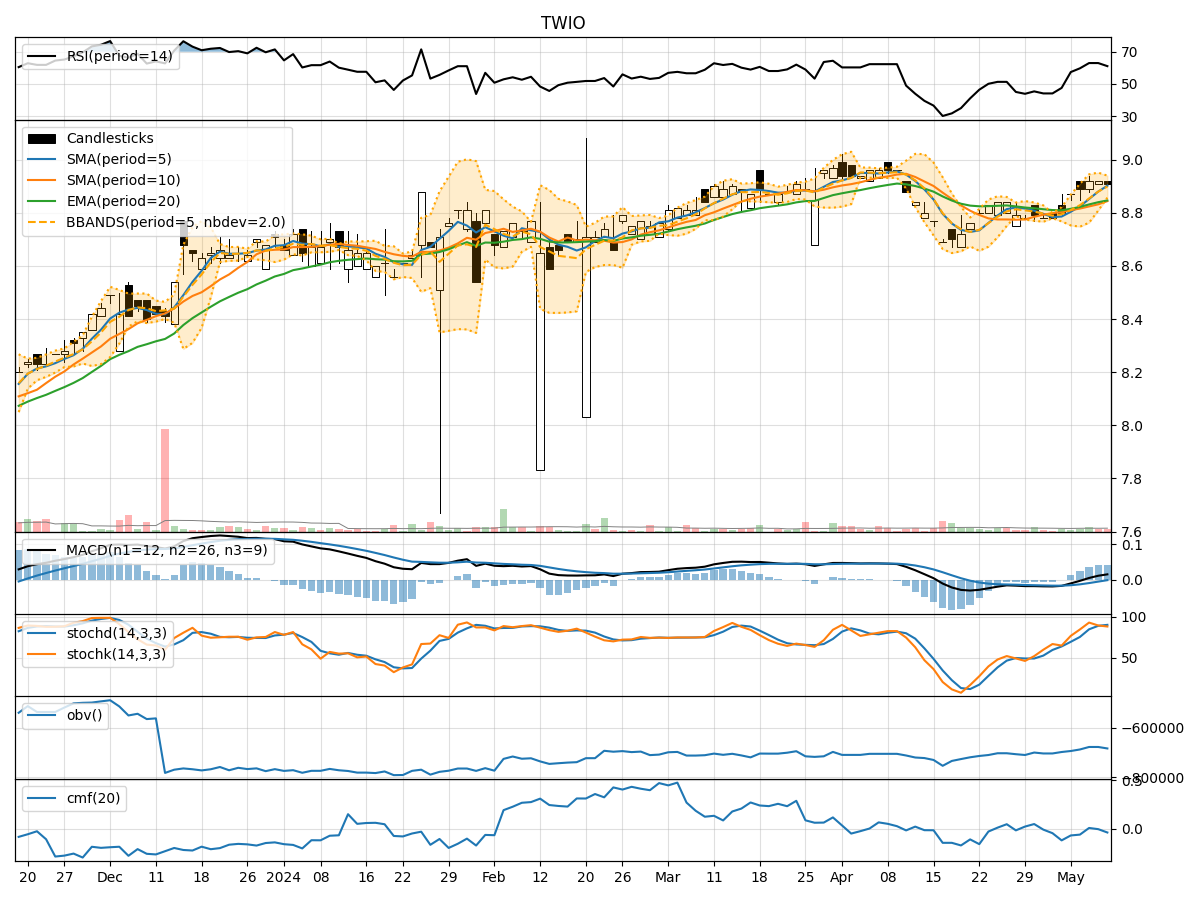
In analyzing the technical indicators for TWIO over the last 5 days, we will delve into the trend, momentum, volatility, and volume indicators to provide a comprehensive outlook on the possible stock price movement. By examining these key aspects, we aim to offer valuable insights and predictions for the upcoming days.
Trend Analysis:
- Moving Averages (MA): The 5-day Moving Average (MA) has been showing an upward trend, indicating a positive momentum in the stock price.
- MACD and Signal Line: The MACD line has been consistently above the Signal line, suggesting a bullish trend in the stock.
- Exponential Moving Average (EMA): The EMA has been steadily increasing, further supporting the bullish sentiment in the stock.
Momentum Analysis:
- Relative Strength Index (RSI): The RSI has been hovering around the 60-70 range, indicating a moderate level of buying pressure.
- Stochastic Oscillator: Both %K and %D lines of the Stochastic Oscillator have been in the overbought territory, signaling a potential reversal or consolidation.
- Williams %R (WillR): The Williams %R has been in the oversold region, suggesting a possible buying opportunity.
Volatility Analysis:
- Bollinger Bands (BB): The Bollinger Bands have been narrowing, indicating decreasing volatility in the stock price.
- Bollinger Band Percentage (BBP): The BBP has been declining, suggesting a potential period of consolidation or a lack of significant price movements.
Volume Analysis:
- On-Balance Volume (OBV): The OBV has been relatively stable, indicating a balance between buying and selling pressure.
- Chaikin Money Flow (CMF): The CMF has been negative, reflecting a slight outflow of money from the stock.
Key Observations:
- The trend indicators suggest a bullish sentiment in the stock, supported by the moving averages and MACD.
- Momentum indicators show a mixed signal with the RSI in a neutral zone, while the Stochastic Oscillator indicates a potential reversal.
- Volatility indicators point towards a period of consolidation or limited price movements.
- Volume indicators reflect a balanced market sentiment with no significant accumulation or distribution.
Conclusion:
Based on the analysis of the technical indicators, the stock price of TWIO is likely to experience sideways movement or consolidation in the upcoming days. The bullish trend indicated by the moving averages and MACD may face resistance due to the overbought conditions highlighted by the Stochastic Oscillator. The narrowing Bollinger Bands and lack of significant volume movements further support the view of a potential period of consolidation. Traders and investors should closely monitor key support and resistance levels for potential breakout or reversal signals.