Technical Analysis of TXSS 2024-05-10
Overview:
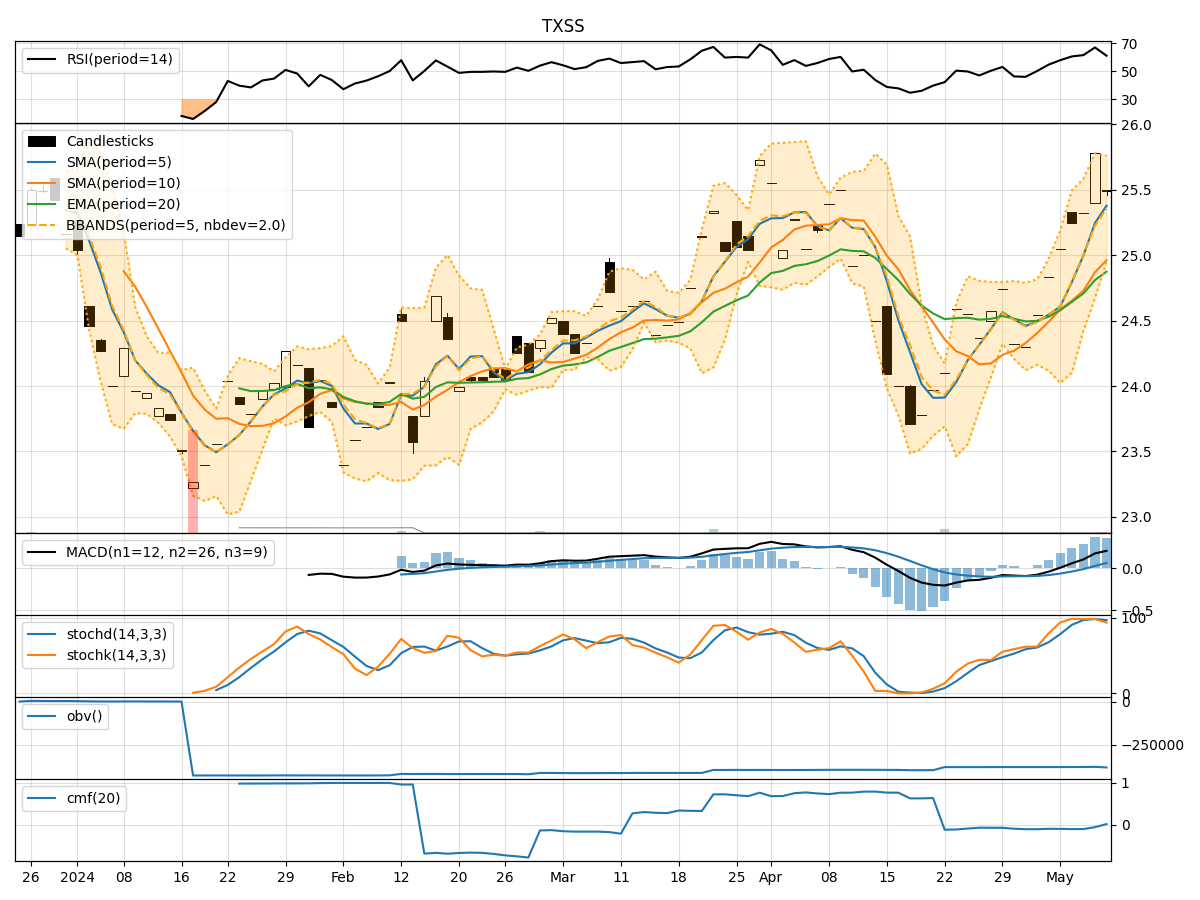
In the last 5 trading days, TXSS stock has shown a consistent uptrend in its closing price, accompanied by increasing trading volumes. The trend indicators suggest a positive momentum with moving averages and MACD showing bullish signals. Momentum indicators like RSI and Stochastic oscillators indicate a strong buying pressure. Volatility indicators show a narrowing Bollinger Band, indicating a potential breakout. Volume indicators also show a positive trend with increasing On-Balance Volume (OBV).
Trend Analysis:
- Moving averages (MA) are trending upwards, indicating a bullish trend.
- MACD is positive and increasing, suggesting a strengthening bullish momentum.
- EMA is above the current price, indicating a potential support level.
Momentum Analysis:
- RSI is in the overbought region, suggesting a strong bullish momentum.
- Stochastic indicators are also in the overbought region, indicating a potential reversal.
- Williams %R is in the oversold region, suggesting a potential buying opportunity.
Volatility Analysis:
- Bollinger Bands are narrowing, indicating a potential decrease in volatility and a possible breakout.
- The current price is close to the upper Bollinger Band, suggesting a potential resistance level.
Volume Analysis:
- On-Balance Volume (OBV) is increasing, indicating strong buying pressure.
- Chaikin Money Flow (CMF) is negative but improving, suggesting a potential reversal in selling pressure.
Conclusion:
Based on the technical indicators and analysis: - The stock is in a strong bullish trend with positive momentum and increasing volumes. - There is a potential for a short-term pullback as the stochastic indicators are in the overbought region. - The narrowing Bollinger Bands suggest a potential breakout, which could lead to a continuation of the uptrend. - Investors should consider buying on dips or wait for a breakout above the upper Bollinger Band for a confirmation of further upside potential.
Key Recommendations:
- Consider buying on pullbacks within the overall bullish trend.
- Monitor the Bollinger Bands for a potential breakout signal.
- Keep an eye on volume for confirmation of buying pressure.
- Set stop-loss levels to manage risk in case of a trend reversal.
Overall Sentiment:
- Bullish with a potential short-term pullback before a continuation of the uptrend.
- Consider buying opportunities on dips or breakout above resistance levels.
By considering these technical indicators and analysis, investors can make informed decisions regarding their positions in TXSS stock.