Technical Analysis of TYLD 2024-05-10
Overview:
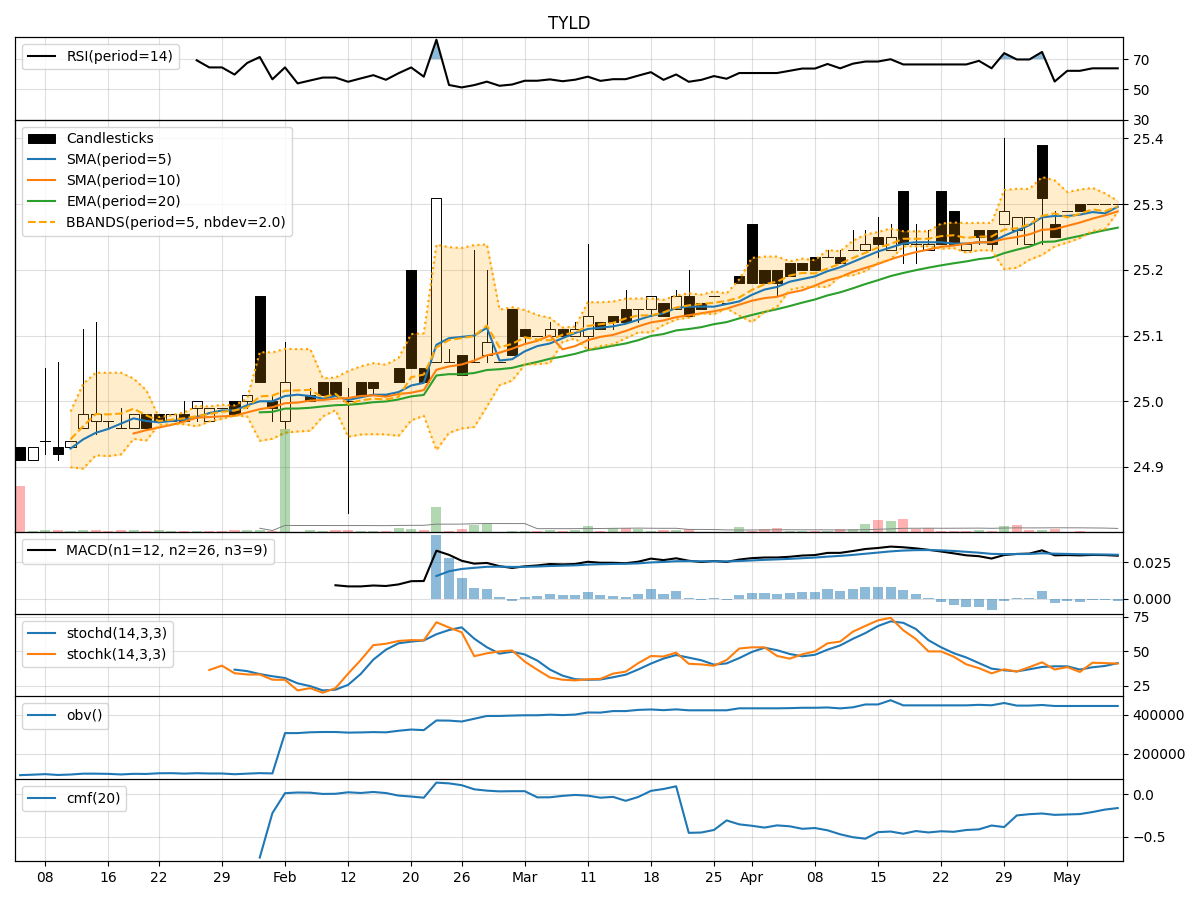
In analyzing the technical indicators for TYLD over the last 5 days, we will delve into the trend, momentum, volatility, and volume indicators to provide a comprehensive outlook on the possible stock price movement in the coming days.
Trend Analysis:
- Moving Averages (MA): The 5-day MA has been steadily increasing, indicating a short-term uptrend in the stock price.
- MACD: The MACD line has been positive, suggesting bullish momentum in the stock.
- Relative Strength Index (RSI): The RSI has been in the neutral zone, indicating neither overbought nor oversold conditions.
Momentum Analysis:
- Stochastic Oscillator: Both %K and %D have been fluctuating around the mid-level, suggesting indecision in momentum.
- Williams %R (WillR): The WillR indicator has been consistently in the oversold territory, indicating a potential reversal.
Volatility Analysis:
- Bollinger Bands (BB): The stock price has been trading within the bands, showing no extreme volatility.
- Bollinger %B (BBP): The %B indicator has been fluctuating within a narrow range, indicating stable price movement.
Volume Analysis:
- On-Balance Volume (OBV): The OBV has been relatively flat, suggesting no significant accumulation or distribution.
- Chaikin Money Flow (CMF): The CMF has been negative, indicating outflow of money from the stock.
Key Observations:
- The trend indicators suggest a mild bullish sentiment in the short term.
- Momentum indicators show mixed signals with no clear direction.
- Volatility remains low, indicating stability in price movement.
- Volume indicators reflect a lack of strong buying or selling pressure.
Conclusion:
Based on the analysis of the technical indicators, the next few days for TYLD are likely to see sideways consolidation with limited price movement. The stock may continue to trade within a narrow range as there is no strong indication of a significant uptrend or downtrend. Traders may consider adopting a wait-and-see approach until clearer signals emerge in the technical indicators.