Technical Analysis of TYLG 2024-05-10
Overview:
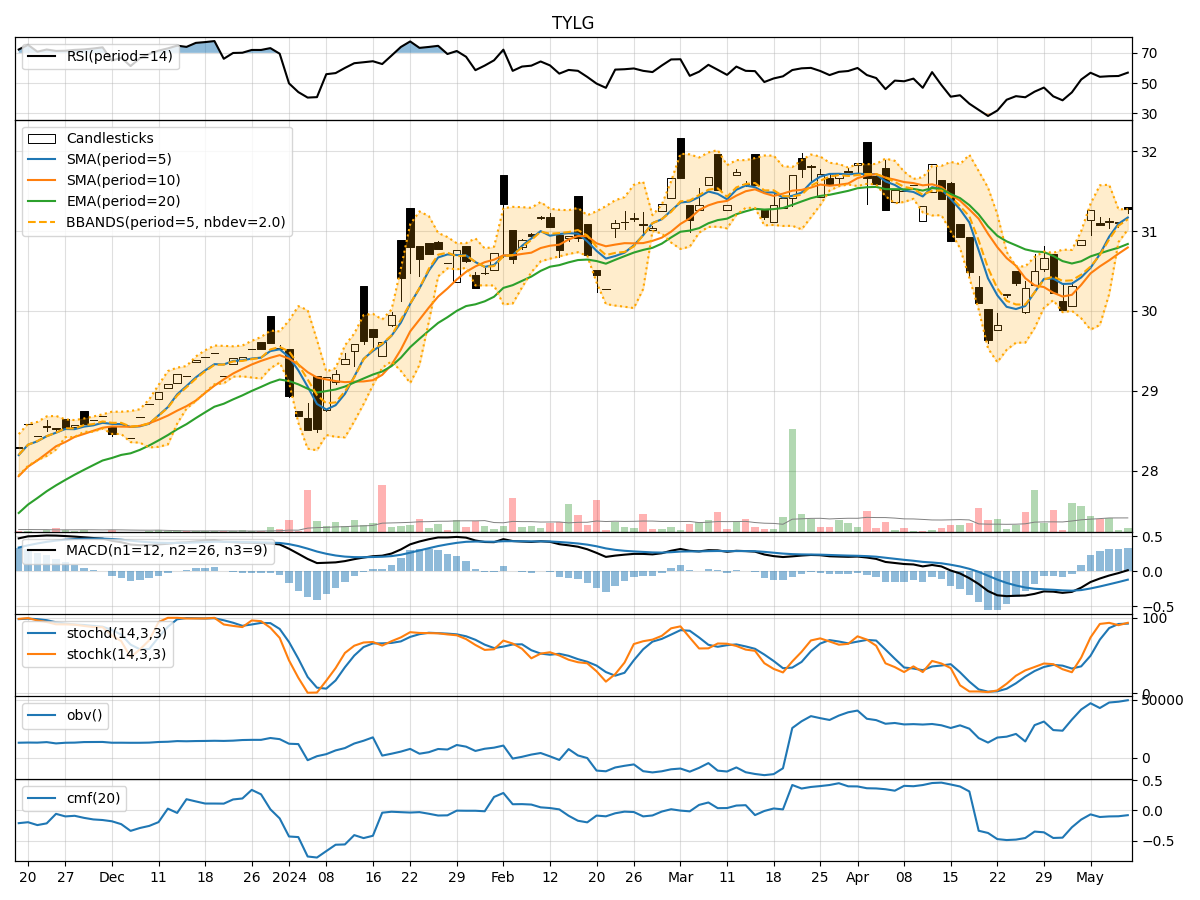
In analyzing the technical indicators for TYLG over the last 5 days, we will delve into the trend, momentum, volatility, and volume indicators to provide a comprehensive outlook on the possible stock price movement in the coming days. By examining these key aspects, we aim to offer valuable insights and predictions to guide your investment decisions.
Trend Analysis:
- Moving Averages (MA): The 5-day Moving Average (MA) has been consistently above the Simple Moving Average (SMA) and Exponential Moving Average (EMA), indicating a bullish trend.
- MACD: The Moving Average Convergence Divergence (MACD) has shown positive values, with the MACD line consistently above the Signal line, suggesting a bullish momentum.
Momentum Analysis:
- RSI: The Relative Strength Index (RSI) has been fluctuating around the 50 level, indicating a neutral momentum.
- Stochastic Oscillator: Both %K and %D values of the Stochastic Oscillator have been in the overbought zone, suggesting a potential reversal or consolidation.
Volatility Analysis:
- Bollinger Bands (BB): The Bollinger Bands have shown narrowing bands, indicating decreasing volatility.
Volume Analysis:
- On-Balance Volume (OBV): The OBV has been relatively stable, suggesting a balance between buying and selling pressure.
- Chaikin Money Flow (CMF): The CMF has been negative, indicating a bearish money flow.
Key Observations:
- The trend indicators suggest a bullish sentiment in the short term.
- Momentum indicators show a neutral to slightly overbought condition.
- Volatility has been decreasing, indicating potential consolidation.
- Volume indicators reflect a balanced market sentiment with a bearish money flow.
Conclusion:
Based on the analysis of the technical indicators, the next few days for TYLG are likely to see sideways movement with a slight bullish bias. Traders should watch for potential reversals as the stock may consolidate before resuming its upward trend. It is advisable to monitor key support and resistance levels for potential entry and exit points.
Disclaimer:
Remember that technical analysis is not a guaranteed predictor of future price movements, and other fundamental factors can influence stock prices. It is essential to conduct thorough research and consider multiple indicators before making any investment decisions. Consulting with a financial advisor can provide tailored insights based on your specific investment goals and risk tolerance level.