Technical Analysis of TYO 2024-05-10
Overview:
In analyzing the technical indicators for TYO stock over the last 5 days, we will delve into the trend, momentum, volatility, and volume indicators to provide a comprehensive outlook on the possible stock price movement in the coming days. By examining these key indicators, we aim to offer valuable insights and predictions for informed decision-making.
Trend Analysis:
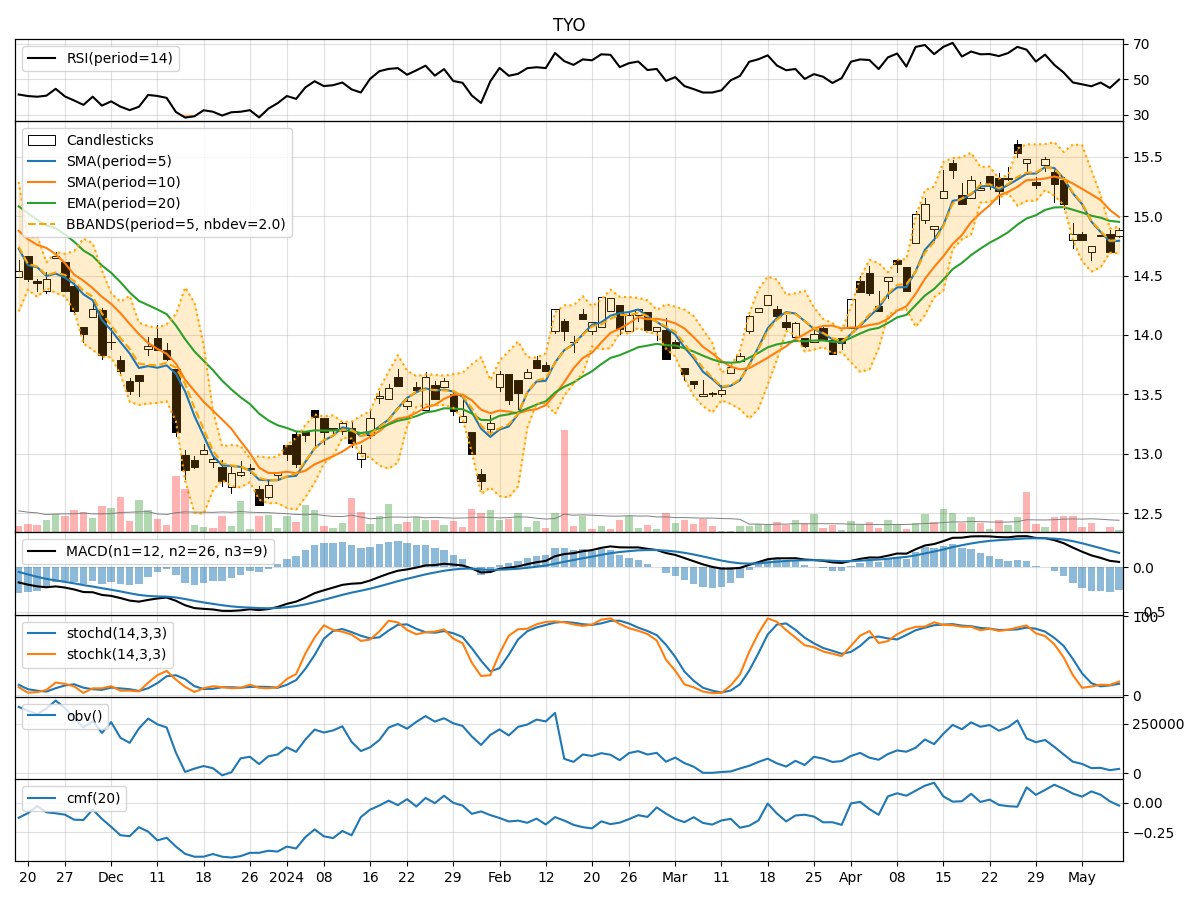
- Moving Averages (MA): The 5-day Moving Average (MA) has been consistently below the closing prices, indicating a short-term downtrend.
- MACD: The MACD line has been positive but decreasing, while the MACD Histogram has been negative, suggesting a potential reversal or weakening of the current uptrend.
Momentum Analysis:
- RSI: The Relative Strength Index (RSI) has been fluctuating around the neutral 50 level, indicating indecision in the market.
- Stochastic Oscillator: Both %K and %D have been rising, but %D remains below 20, suggesting a potential oversold condition.
Volatility Analysis:
- Bollinger Bands (BB): The stock price has been trading within the Bollinger Bands, with the bands narrowing, indicating decreasing volatility.
Volume Analysis:
- On-Balance Volume (OBV): The OBV has been declining, indicating selling pressure in the market.
- Chaikin Money Flow (CMF): The CMF has been positive but decreasing, signaling a potential outflow of money from the stock.
Key Observations:
- The trend indicators suggest a short-term downtrend, supported by the decreasing MACD Histogram.
- Momentum indicators show mixed signals, with RSI around 50 and Stochastic %D indicating a potential oversold condition.
- Volatility has been decreasing, as seen in the narrowing Bollinger Bands.
- Volume indicators point towards selling pressure, with OBV declining and CMF showing a decrease in buying pressure.
Conclusion:
Based on the analysis of the technical indicators, the stock price of TYO is likely to experience further downward movement in the coming days. The trend is bearish, supported by weakening momentum and increasing selling pressure. Traders should exercise caution and consider shorting positions or waiting for a more favorable entry point. It is advisable to closely monitor the price action and key support levels for potential reversals.