Technical Analysis of UAE 2024-05-10
Overview:
In analyzing the technical indicators for the UAE stock over the last 5 days, we will delve into the trend, momentum, volatility, and volume indicators to provide a comprehensive outlook on the possible stock price movement in the coming days. By examining these key indicators, we aim to offer valuable insights and predictions for potential investors and traders.
Trend Analysis:
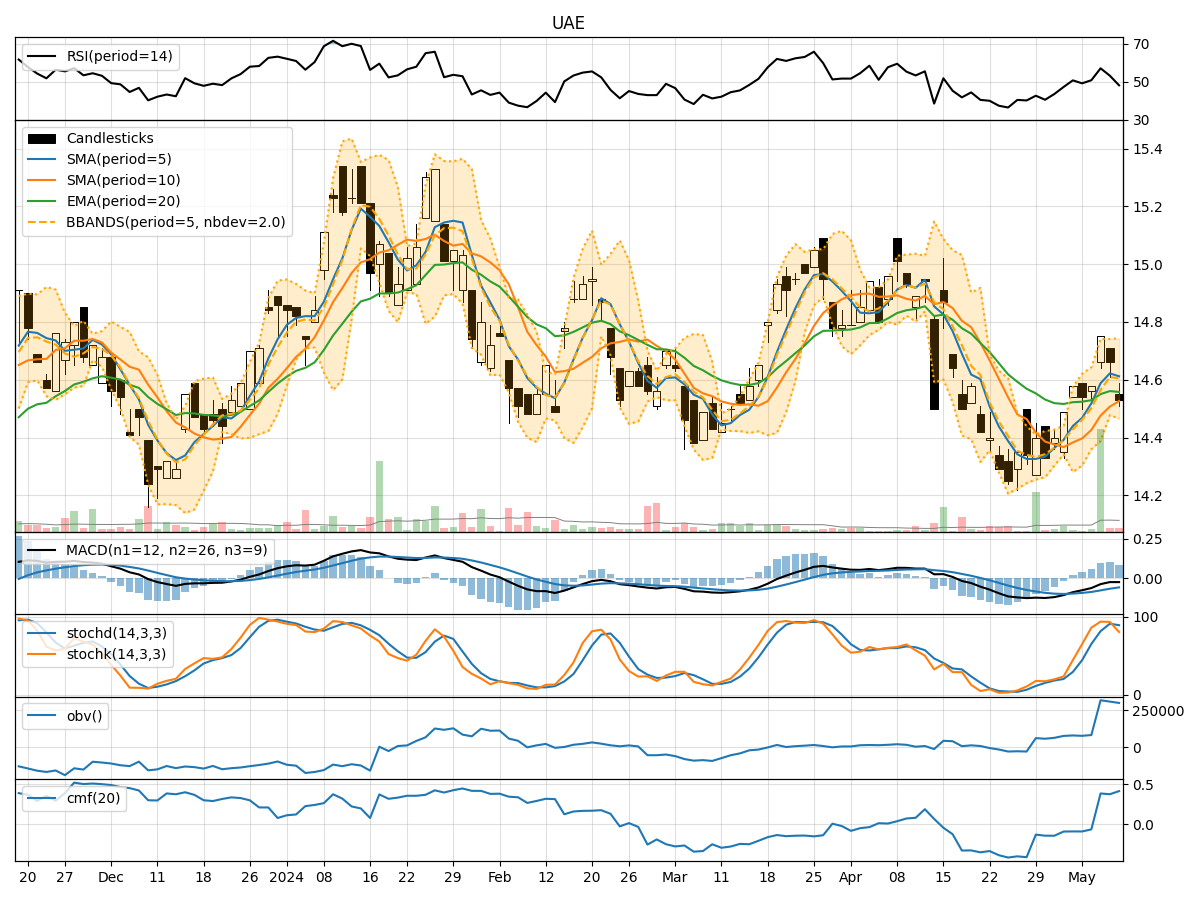
- Moving Averages (MA): The 5-day Moving Average (MA) has been fluctuating around the closing prices, indicating short-term price trends. The Simple Moving Average (SMA) and Exponential Moving Average (EMA) show a slight upward trend, suggesting a bullish sentiment.
- Moving Average Convergence Divergence (MACD): The MACD line has been consistently below the signal line, indicating a bearish trend. However, the MACD Histogram has shown signs of convergence, hinting at a potential trend reversal.
Momentum Analysis:
- Relative Strength Index (RSI): The RSI values have been fluctuating around the midline, indicating a lack of strong momentum in either direction.
- Stochastic Oscillator: Both %K and %D values have been relatively high, suggesting overbought conditions in the market.
- Williams %R (Willams %R): The Williams %R values have been consistently in the oversold territory, indicating a potential reversal in the near future.
Volatility Analysis:
- Bollinger Bands (BB): The Bollinger Bands have been narrowing, indicating decreasing volatility in the stock price. The bands are relatively close to each other, suggesting a period of consolidation.
- Bollinger Percent (BBP): The Bollinger Percent values have been low, indicating that the stock price is currently trading near the lower band.
Volume Analysis:
- On-Balance Volume (OBV): The OBV values have shown a slight increase over the last few days, indicating a potential accumulation of the stock.
- Chaikin Money Flow (CMF): The CMF values have been positive, suggesting that money is flowing into the stock.
Conclusion:
Based on the analysis of the technical indicators, the stock is currently exhibiting mixed signals. The trend indicators suggest a potential bullish sentiment in the short term, supported by the moving averages. However, the momentum indicators indicate a lack of strong momentum, with overbought conditions in the market.
The volatility analysis points towards a period of consolidation, with decreasing volatility and the stock trading near the lower Bollinger Band. The volume indicators show a slight increase in accumulation, supported by positive CMF values.
Overall Assessment:
- Trend: Upward
- Momentum: Neutral
- Volatility: Consolidation
- Volume: Accumulation
Final Verdict:
Considering the overall analysis, the stock is likely to experience upward movement in the coming days, with a potential for consolidation and accumulation. Investors should closely monitor the momentum indicators for any signs of a shift in market sentiment.