Technical Analysis of UAPR 2024-05-10
Overview:
In analyzing the technical indicators for UAPR stock over the last 5 days, we will delve into the trend, momentum, volatility, and volume indicators to provide a comprehensive outlook on the possible stock price movement in the coming days. By examining these key indicators, we aim to offer valuable insights and predictions for potential investors.
Trend Indicators:
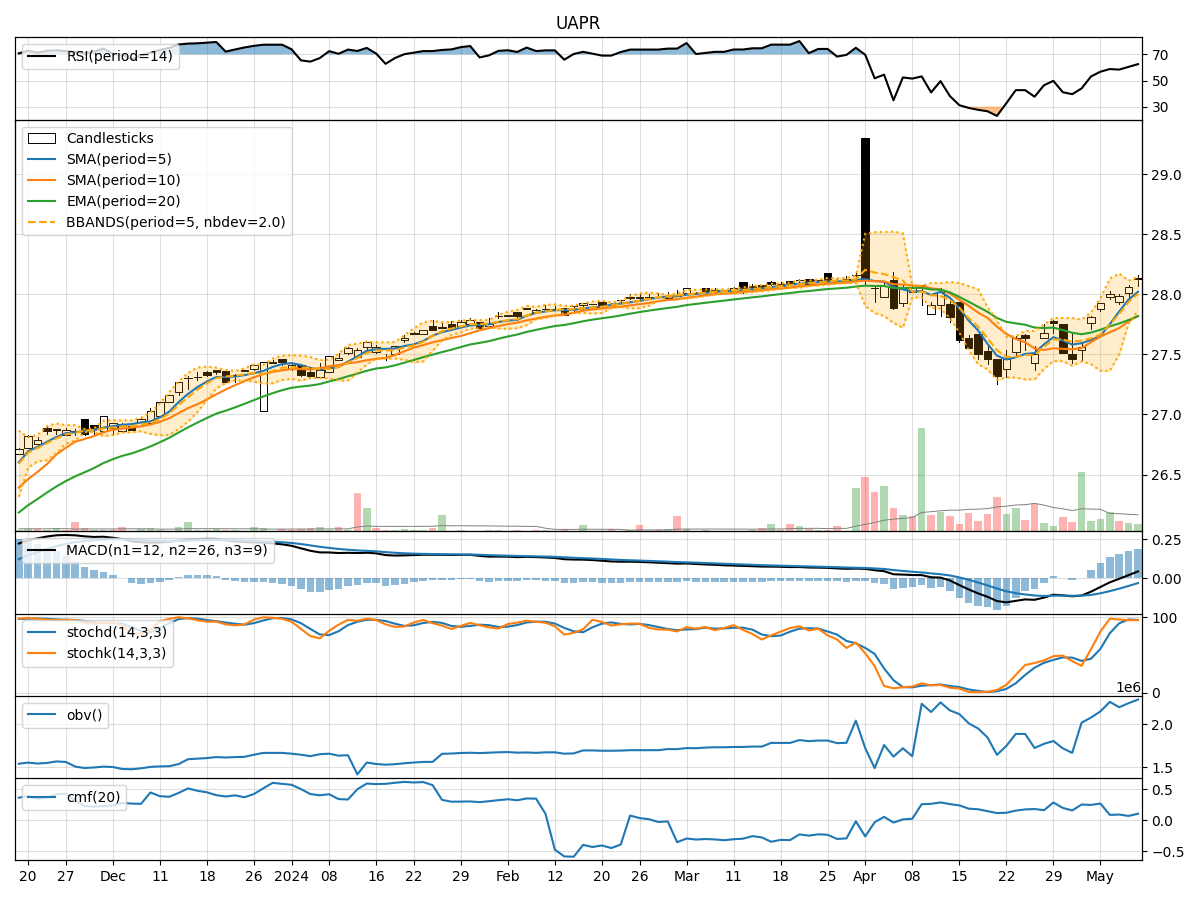
- Moving Averages (MA): The 5-day moving average has been consistently above the simple moving average (SMA) and exponential moving average (EMA), indicating a bullish trend.
- MACD: The MACD line has been consistently above the signal line, with both lines showing an upward trend, suggesting bullish momentum.
- RSI: The Relative Strength Index (RSI) has been increasing and is currently in the overbought territory, indicating a strong bullish momentum.
Momentum Indicators:
- Stochastic Oscillator: Both %K and %D lines of the Stochastic Oscillator are in the overbought zone, suggesting a potential reversal or consolidation.
- Williams %R: The Williams %R is also in the overbought region, signaling a possible pullback in the stock price.
Volatility Indicators:
- Bollinger Bands: The stock price has been trading within the upper Bollinger Band, indicating an overbought condition and a potential reversal.
- Average True Range (ATR): The ATR has been relatively stable, suggesting consistent volatility in the stock price.
Volume Indicators:
- On-Balance Volume (OBV): The OBV has been increasing, indicating accumulation by investors.
- Chaikin Money Flow (CMF): The CMF has been positive, suggesting buying pressure in the stock.
Key Observations and Opinions:
- Trend: The trend indicators suggest a strong bullish sentiment in the stock.
- Momentum: The momentum indicators show overbought conditions, indicating a potential reversal or consolidation.
- Volatility: The Bollinger Bands and overbought conditions suggest a possible pullback in the stock price.
- Volume: The increasing OBV and positive CMF indicate buying interest in the stock.
Conclusion:
Based on the analysis of the technical indicators, the stock is currently in an overbought state with strong bullish momentum. However, the overbought conditions in the momentum and Williams %R indicators suggest a potential pullback or consolidation in the stock price in the coming days. Investors should exercise caution and consider waiting for a better entry point before initiating new positions.