Technical Analysis of UAUG 2024-05-10
Overview:
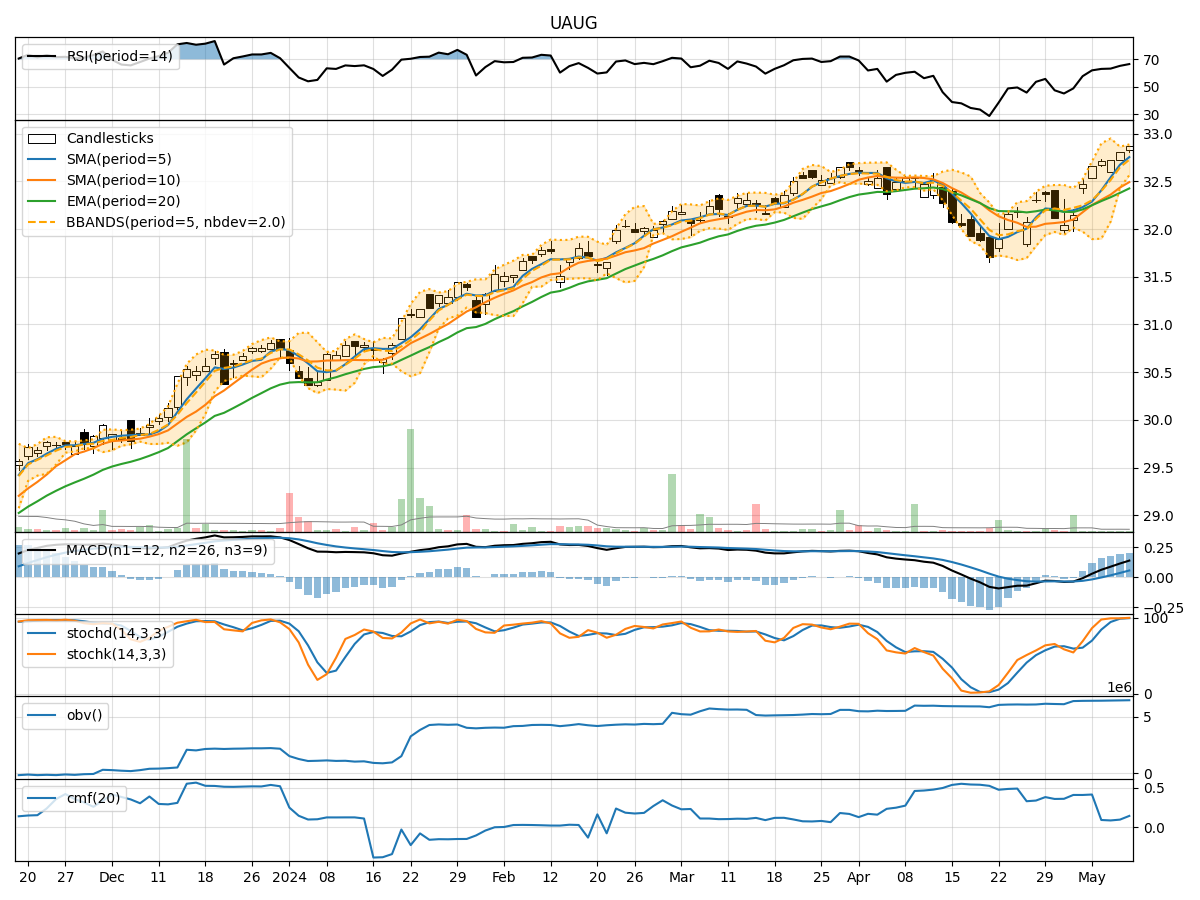
In analyzing the technical indicators for UAUG stock over the last 5 days, we will delve into the trends, momentum, volatility, and volume aspects to provide a comprehensive outlook on the possible stock price movement in the coming days. By examining key indicators such as moving averages, MACD, RSI, Stochastic Oscillator, Bollinger Bands, OBV, and Chaikin Money Flow, we aim to offer valuable insights and predictions for potential price action.
Trend Analysis:
- Moving Averages (MA): The 5-day MA has been consistently above the 10-day SMA, indicating a short-term bullish trend.
- MACD: The MACD line has been above the signal line, with both showing an upward trend, suggesting bullish momentum.
Momentum Analysis:
- RSI: The RSI has been trending upwards and is currently in the overbought territory, indicating strong buying pressure.
- Stochastic Oscillator: Both %K and %D have been in the overbought zone, suggesting a potential reversal or consolidation.
Volatility Analysis:
- Bollinger Bands: The stock price has been trading within the bands, with the bands narrowing, indicating decreasing volatility.
Volume Analysis:
- On-Balance Volume (OBV): The OBV has been steadily increasing, reflecting accumulation by investors.
- Chaikin Money Flow (CMF): The CMF has been positive, indicating buying pressure in the stock.
Key Observations:
- The stock is currently in an upward trend based on moving averages and MACD.
- Momentum indicators like RSI and Stochastic Oscillator suggest the stock is overbought and may experience a pullback or consolidation.
- Volatility is decreasing, as seen in the narrowing Bollinger Bands.
- Volume indicators show positive accumulation and buying pressure.
Conclusion:
Based on the technical analysis of UAUG stock, the next few days may see a potential pullback or consolidation due to overbought conditions indicated by momentum indicators. However, the overall trend remains bullish supported by moving averages and MACD. Traders should be cautious of a possible correction in the short term but maintain a long-term bullish view on the stock.