Technical Analysis of UBOT 2024-05-10
Overview:
In analyzing the technical indicators for UBOT over the last 5 days, we will delve into the trend, momentum, volatility, and volume indicators to provide a comprehensive outlook on the possible stock price movement in the coming days. By examining key metrics such as moving averages, MACD, RSI, Bollinger Bands, and OBV, we aim to offer valuable insights and predictions for potential price action.
Trend Indicators:
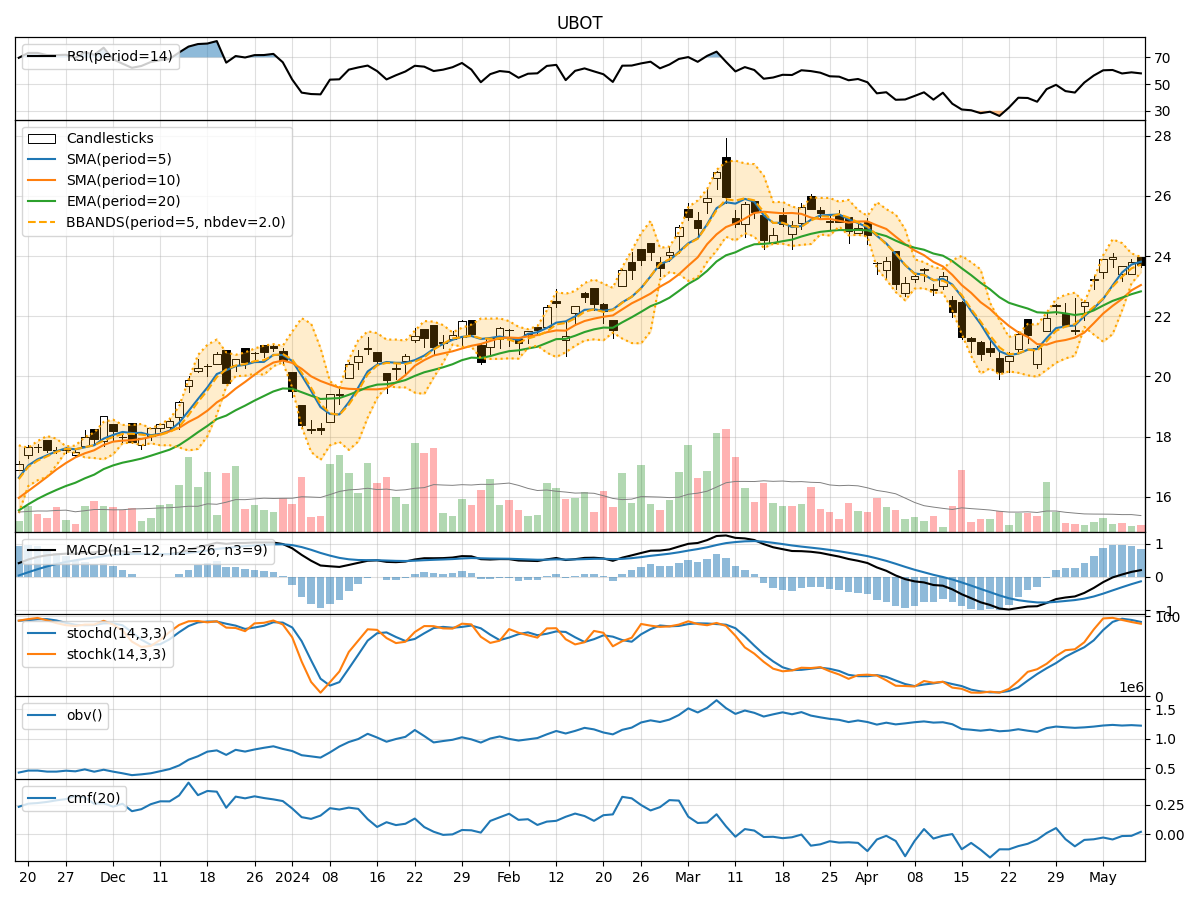
- Moving Averages (MA): The 5-day MA has been consistently above the closing prices, indicating a bullish trend.
- MACD: The MACD line has been above the signal line, suggesting positive momentum.
- EMA: The EMA has been trending upwards, supporting the bullish sentiment.
Momentum Indicators:
- RSI: The RSI has been hovering around 60, indicating a neutral stance.
- Stochastic Oscillator: Both %K and %D have been gradually decreasing, signaling a potential reversal.
- Williams %R: The indicator has been in oversold territory, hinting at a possible buying opportunity.
Volatility Indicators:
- Bollinger Bands: The bands have been narrowing, suggesting decreasing volatility.
- Bollinger %B: The %B indicator has been increasing, indicating a potential uptrend.
Volume Indicators:
- On-Balance Volume (OBV): The OBV has been fluctuating, reflecting indecision among market participants.
- Chaikin Money Flow (CMF): The CMF has been negative, indicating selling pressure.
Key Observations:
- The trend indicators point towards a bullish sentiment with moving averages and MACD supporting upward momentum.
- Momentum indicators show a mixed picture with RSI neutral, Stochastic indicating a potential reversal, and Williams %R signaling oversold conditions.
- Volatility indicators suggest decreasing volatility, potentially leading to a period of consolidation.
- Volume indicators reflect indecision in the market with OBV fluctuating and CMF showing selling pressure.
Conclusion:
Based on the analysis of the technical indicators, the next few days for UBOT could see sideways movement with a slight bias towards consolidation. The bullish trend indicated by moving averages and MACD may face resistance due to the mixed signals from momentum indicators and selling pressure reflected in volume indicators. Traders should exercise caution and wait for clearer signals before taking significant positions.