Technical Analysis of UCC 2024-05-10
Overview:
In analyzing the technical indicators for UCC stock over the last 5 days, we will delve into the trend, momentum, volatility, and volume indicators to provide a comprehensive outlook on the possible stock price movement in the coming days.
Trend Analysis:
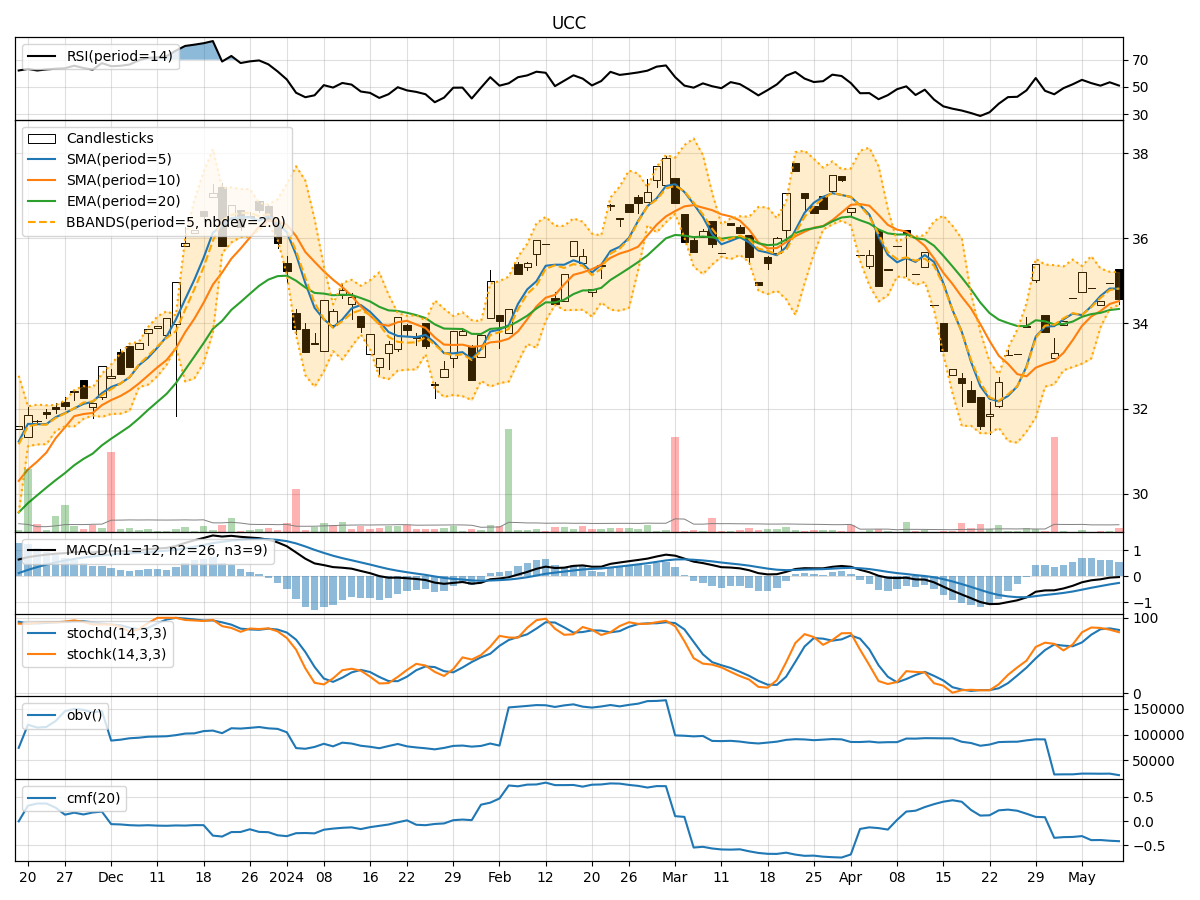
- Moving Averages (MA): The 5-day Moving Average (MA) has been consistently above the Simple Moving Average (SMA) and Exponential Moving Average (EMA), indicating a short-term uptrend.
- MACD: The MACD line has been negative but converging towards the signal line, suggesting a potential reversal in the downtrend.
- MACD Histogram: The MACD Histogram has been gradually decreasing, indicating a weakening bearish momentum.
Momentum Analysis:
- RSI: The Relative Strength Index (RSI) has been fluctuating around the 50 level, indicating a lack of strong momentum in either direction.
- Stochastic Oscillator: Both %K and %D have been declining, signaling a potential oversold condition.
- Williams %R: The Williams %R has been consistently in the oversold territory, suggesting a possible reversal to the upside.
Volatility Analysis:
- Bollinger Bands (BB): The stock price has been trading within the Bollinger Bands, with the bands narrowing, indicating decreasing volatility.
- Bollinger %B: The %B indicator has been hovering around the middle band, suggesting a balanced market sentiment.
Volume Analysis:
- On-Balance Volume (OBV): The OBV has been declining, indicating a net selling pressure in the stock.
- Chaikin Money Flow (CMF): The CMF has been negative, reflecting a lack of buying interest in the stock.
Conclusion:
Based on the analysis of the technical indicators, the stock is currently in a sideways consolidation phase with a slight bullish bias. The trend indicators suggest a potential reversal in the short-term downtrend, supported by the convergence of the MACD lines. However, the lack of strong momentum, coupled with decreasing volatility and negative volume indicators, indicates a cautious outlook.
Recommendation:
- Short-Term: Expect the stock price to consolidate within a narrow range in the coming days.
- Medium- to Long-Term: Monitor the MACD for a bullish crossover and look for confirmation from increasing buying volume before considering a long position.
Key Takeaways:
- Potential Upside: Watch for a breakout above the recent highs for a bullish confirmation.
- Potential Downside: A break below the lower Bollinger Band may signal a continuation of the downtrend.
In conclusion, while the stock shows signs of a possible reversal, it is essential to exercise caution and wait for stronger confirmation signals before making significant trading decisions.