Technical Analysis of UCIB 2024-05-10
Overview:
In analyzing the technical indicators for UCIB stock over the last 5 days, we will delve into the trends, momentum, volatility, and volume indicators to provide a comprehensive outlook on the possible stock price movement in the coming days. By examining these key aspects, we aim to offer valuable insights and predictions to guide your investment decisions.
Trend Indicators:
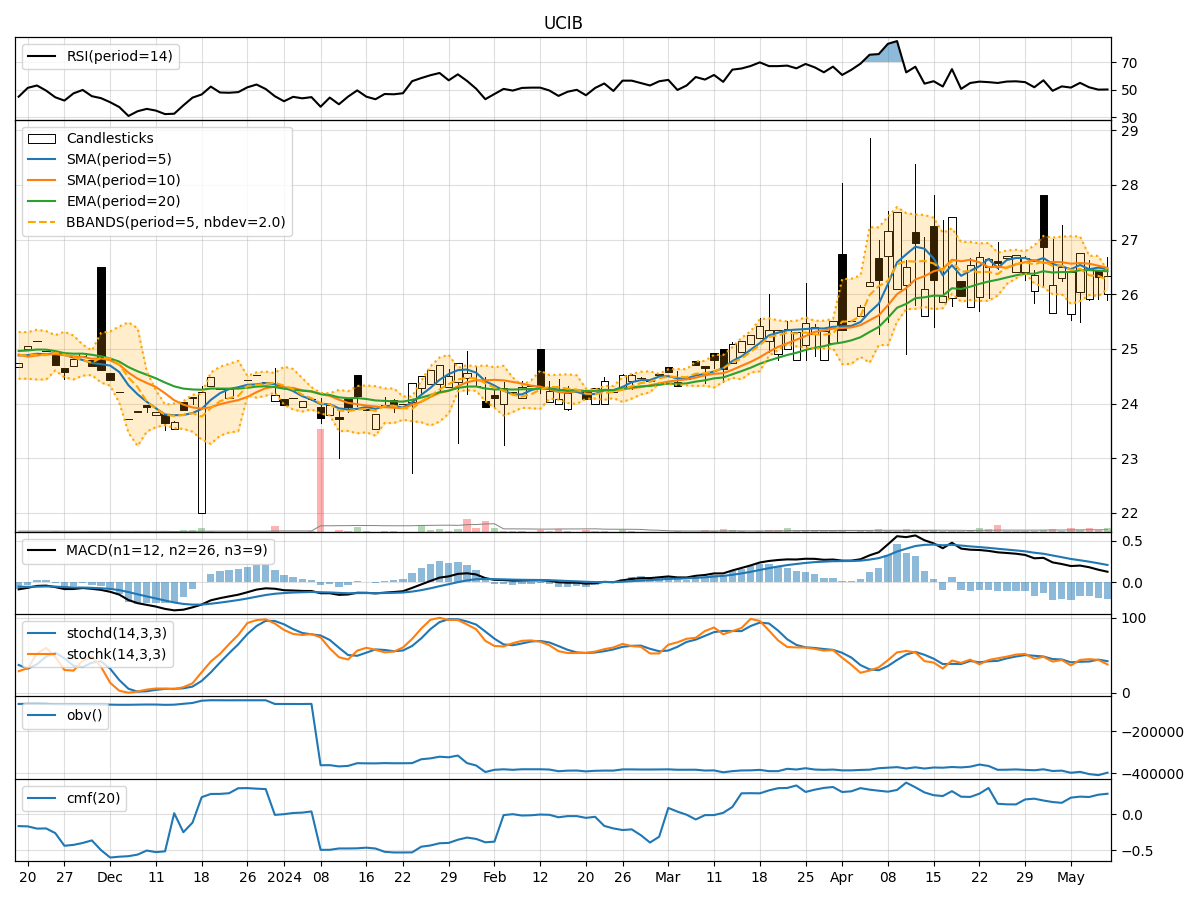
- Moving Averages (MA): The 5-day MA has been fluctuating around the closing prices, indicating a lack of clear trend direction.
- MACD: The MACD line has been positive, but the MACD Histogram has been decreasing, suggesting a potential weakening of the bullish momentum.
- EMA: The EMA has been relatively stable, reflecting a moderate trend in the stock price.
Momentum Indicators:
- RSI: The RSI has been hovering around the neutral zone, indicating a balanced momentum between buying and selling pressure.
- Stochastic Oscillator: Both %K and %D have shown mixed signals, with no clear indication of overbought or oversold conditions.
- Williams %R: The Williams %R has been consistently in the oversold territory, suggesting a potential reversal in the short term.
Volatility Indicators:
- Bollinger Bands: The Bollinger Bands have been relatively narrow, indicating low volatility in the stock price movement.
- Bollinger %B: The %B indicator has been fluctuating within a tight range, reflecting a lack of significant price volatility.
Volume Indicators:
- On-Balance Volume (OBV): The OBV has shown a mixed trend, with alternating positive and negative values, indicating indecision among investors.
- Chaikin Money Flow (CMF): The CMF has been positive, suggesting that money flow into the stock has been relatively strong over the past 20 days.
Key Observations and Opinions:
- Trend: The trend indicators suggest a lack of clear direction in the stock price movement, with mixed signals from moving averages and MACD.
- Momentum: Momentum indicators indicate a neutral stance, with no strong bullish or bearish bias in the short term.
- Volatility: Volatility indicators point towards low volatility, which may lead to a period of consolidation or sideways movement.
- Volume: Volume indicators show indecision among investors, with no significant accumulation or distribution patterns.
Conclusion:
Based on the analysis of the technical indicators, the stock price of UCIB is likely to experience sideways movement in the coming days. The lack of clear trends, mixed momentum signals, low volatility, and indecisive volume patterns suggest a period of consolidation. Investors should exercise caution and wait for clearer signals before making significant trading decisions.