Technical Analysis of UCON 2024-05-10
Overview:
In analyzing the technical indicators for UCON stock over the last 5 days, we will delve into the trend, momentum, volatility, and volume indicators to provide a comprehensive outlook on the possible stock price movement in the coming days. By examining these key indicators, we aim to offer valuable insights and predictions to guide investment decisions.
Trend Indicators:
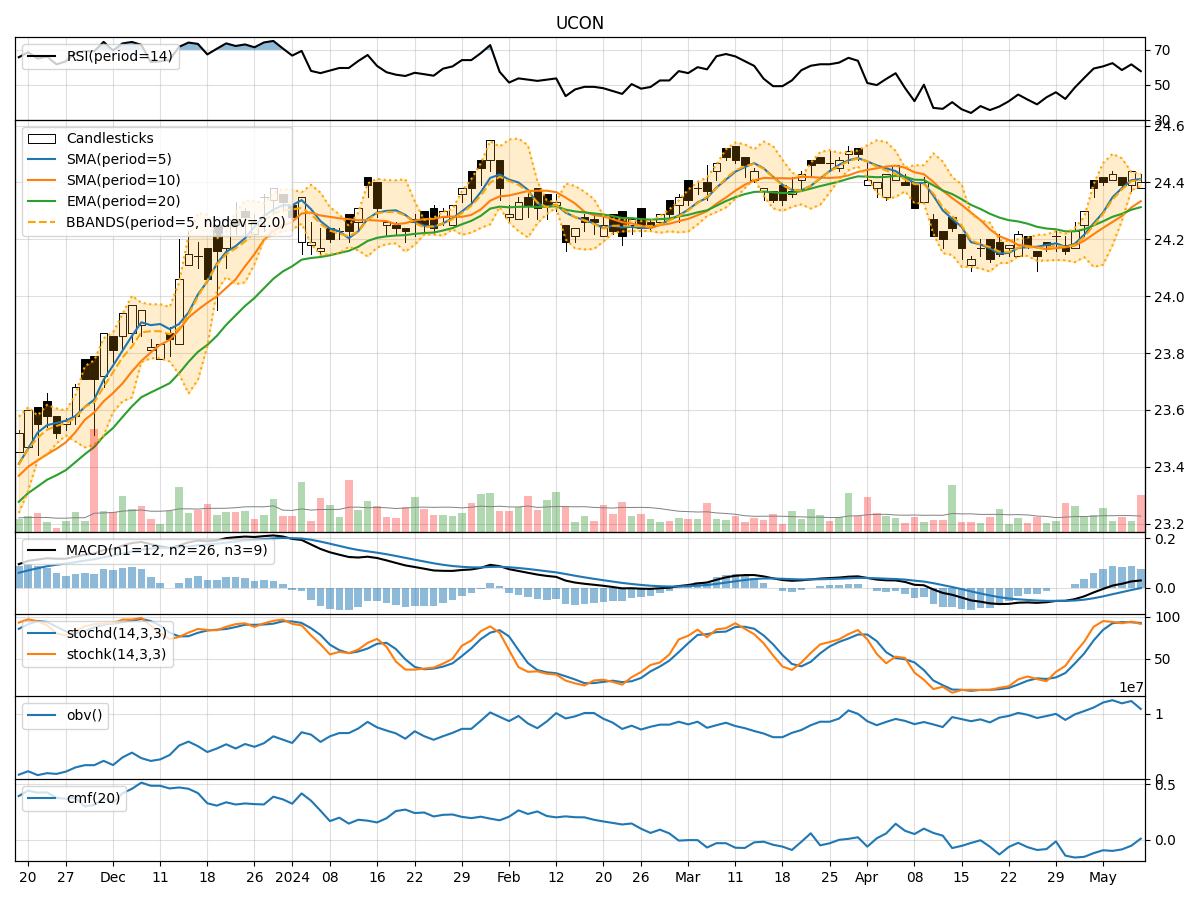
- Moving Averages (MA): The 5-day Moving Average (MA) has been consistently above the Simple Moving Average (SMA) and Exponential Moving Average (EMA), indicating a short-term uptrend.
- MACD: The MACD line has been consistently above the signal line, with the MACD Histogram showing positive values, suggesting bullish momentum.
Momentum Indicators:
- RSI: The Relative Strength Index (RSI) has been fluctuating around the 60-62 range, indicating a neutral momentum.
- Stochastic Oscillator: Both %K and %D have been hovering in the overbought territory, suggesting a potential reversal or consolidation.
- Williams %R: The Williams %R is showing oversold conditions, signaling a possible reversal to the upside.
Volatility Indicators:
- Bollinger Bands: The stock price has been trading within the Bollinger Bands, with the bands narrowing, indicating decreasing volatility.
Volume Indicators:
- On-Balance Volume (OBV): The OBV has been fluctuating, indicating indecision among investors.
- Chaikin Money Flow (CMF): The CMF has been negative, suggesting selling pressure in the stock.
Key Observations:
- The trend indicators suggest a bullish sentiment in the short term.
- Momentum indicators show mixed signals with potential for a reversal.
- Volatility is decreasing, indicating a possible period of consolidation.
- Volume indicators reflect indecision and selling pressure in the market.
Conclusion:
Based on the analysis of the technical indicators, the stock is likely to experience sideways movement in the coming days. The bullish trend may face resistance due to overbought conditions in the momentum indicators and selling pressure indicated by volume indicators. Traders should exercise caution and consider waiting for clearer signals before making significant trading decisions.