Technical Analysis of UCYB 2024-05-10
Overview:
In analyzing the technical indicators for UCYB over the last 5 days, we will delve into the trend, momentum, volatility, and volume indicators to provide a comprehensive outlook on the possible stock price movement in the coming days. By examining these key indicators, we aim to offer valuable insights and predictions to guide investment decisions.
Trend Analysis:
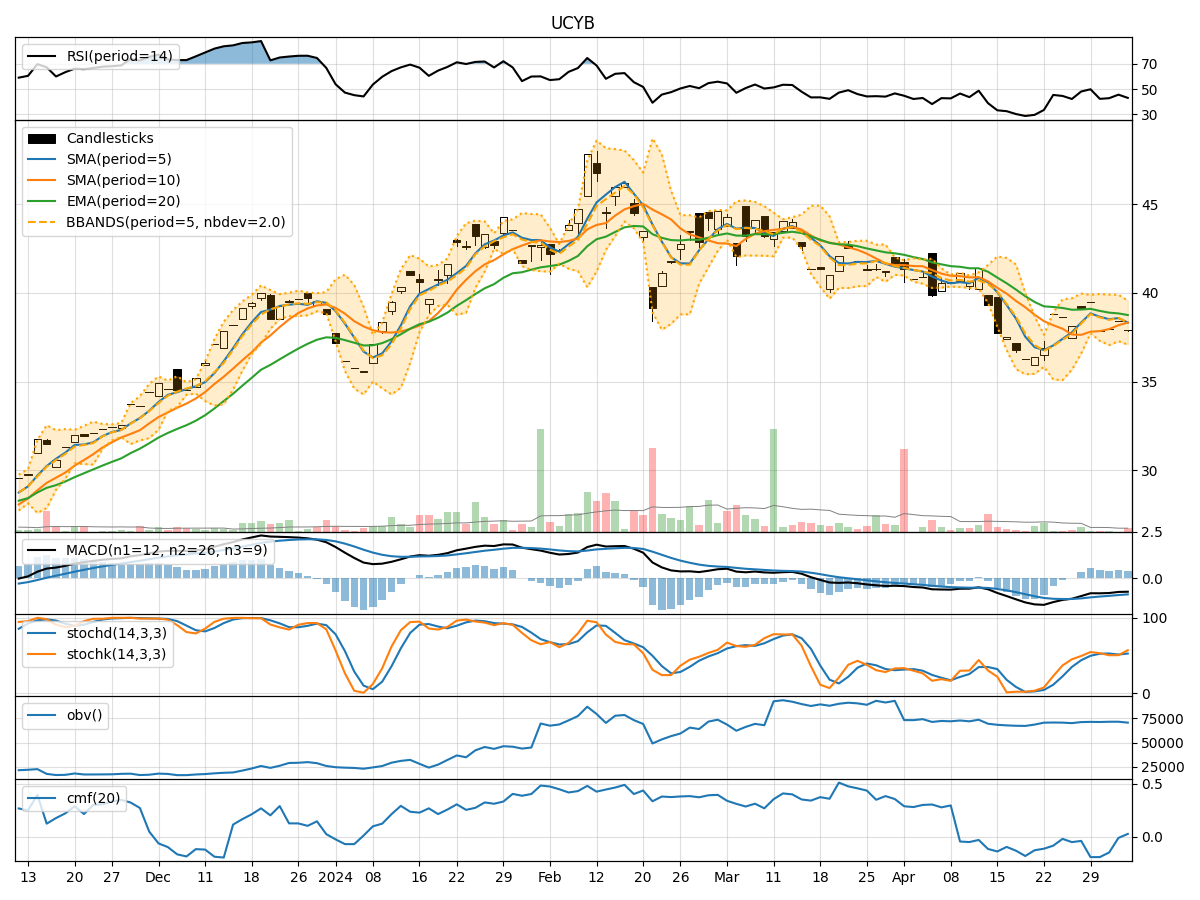
- Moving Averages (MA): The 5-day MA has been fluctuating around the closing prices, indicating short-term price trends. The SMA(10) and EMA(20) have shown a slight decline, suggesting a weakening trend.
- MACD: The MACD line has been negative, with the MACD histogram showing a decreasing trend, indicating a bearish momentum.
Momentum Analysis:
- RSI: The RSI has been hovering around the neutral zone, indicating a lack of strong momentum in either direction.
- Stochastic Oscillator: The Stochastics have been fluctuating, but recently showing signs of oversold conditions, suggesting a potential reversal.
Volatility Analysis:
- Bollinger Bands (BB): The bands have been narrowing, indicating decreasing volatility and a potential consolidation phase.
Volume Analysis:
- On-Balance Volume (OBV): The OBV has been fluctuating, suggesting indecision among market participants.
- Chaikin Money Flow (CMF): The CMF has been negative, indicating selling pressure in the market.
Key Observations:
- The trend indicators suggest a weakening trend.
- Momentum indicators show a lack of strong directional momentum.
- Volatility is decreasing, indicating a potential consolidation phase.
- Volume indicators reflect indecision and selling pressure in the market.
Conclusion:
Based on the analysis of the technical indicators, the stock of UCYB is likely to experience sideways movement in the coming days. The weakening trend, lack of strong momentum, decreasing volatility, and selling pressure indicated by the volume indicators suggest a period of consolidation. Investors should exercise caution and closely monitor the price action for any potential breakout or reversal signals before making trading decisions.