Technical Analysis of UDEC 2024-05-10
Overview:
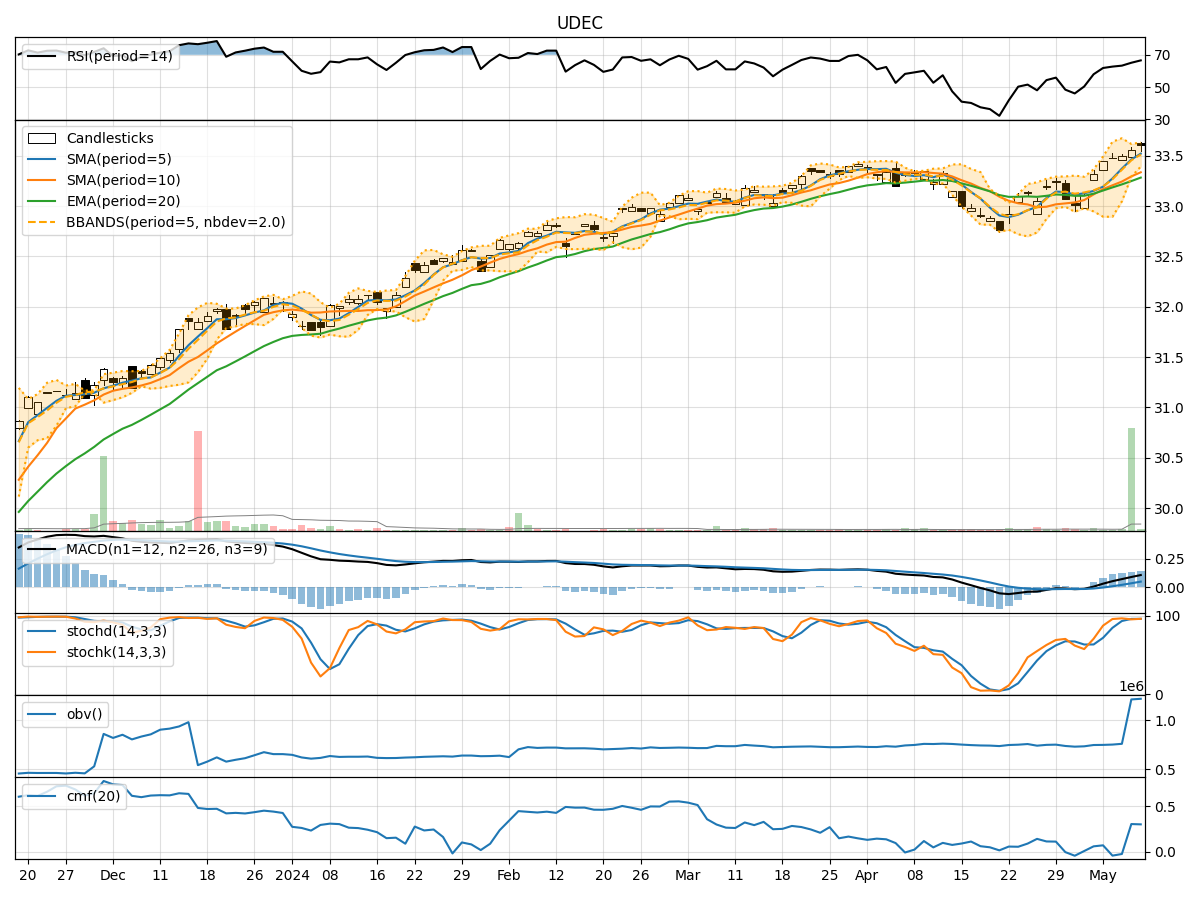
In the last 5 trading days, UDEC stock has shown a consistent uptrend in both price and volume. The moving averages have been trending upwards, indicating a bullish sentiment. Momentum indicators like RSI and Stochastic oscillators suggest the stock is in overbought territory but still showing strength. Volatility indicators show a narrowing of Bollinger Bands, indicating potential consolidation. Volume indicators confirm the increasing buying pressure.
Trend Indicators Analysis:
- Moving Averages (MA): The 5-day MA has been consistently above the longer-term SMAs, indicating a strong bullish trend.
- MACD: The MACD line has been above the signal line, showing positive momentum.
- MACD Histogram: The histogram has been increasing, indicating strengthening bullish momentum.
Momentum Indicators Analysis:
- RSI: The RSI is in the overbought region, suggesting a potential pullback or consolidation.
- Stochastic Oscillators: Both %K and %D are in the overbought zone, indicating a possible reversal.
- Williams %R: The indicator is also in the overbought territory, signaling a potential downward movement.
Volatility Indicators Analysis:
- Bollinger Bands (BB): The bands are narrowing, indicating decreasing volatility and a potential period of consolidation.
- Bollinger %B: The %B is above 0.8, suggesting the stock is trading near the upper band and may be overextended.
Volume Indicators Analysis:
- On-Balance Volume (OBV): The OBV has been steadily increasing, confirming the uptrend and accumulation of the stock.
- Chaikin Money Flow (CMF): The CMF is positive, indicating strong buying pressure and accumulation.
Conclusion:
Based on the technical indicators and analysis: - Trend: The stock is in a strong upward trend. - Momentum: Momentum indicators suggest a potential pullback or consolidation due to overbought conditions. - Volatility: Volatility is decreasing, indicating a possible period of consolidation. - Volume: Increasing volume confirms the bullish trend.
Forecast:
Given the current technical outlook, the stock is likely to experience a short-term consolidation or a minor pullback in the next few days due to overbought conditions. However, the overall trend remains bullish, and any dips could present buying opportunities for investors looking to enter or add to their positions. Keep a close watch on key support levels for potential entry points.