Technical Analysis of UDOW 2024-05-10
Overview:
In analyzing the technical indicators for UDOW over the last 5 days, we will delve into the trend, momentum, volatility, and volume indicators to provide a comprehensive outlook on the possible stock price movement in the coming days. By examining these key indicators, we aim to offer valuable insights and predictions for potential investors.
Trend Analysis:
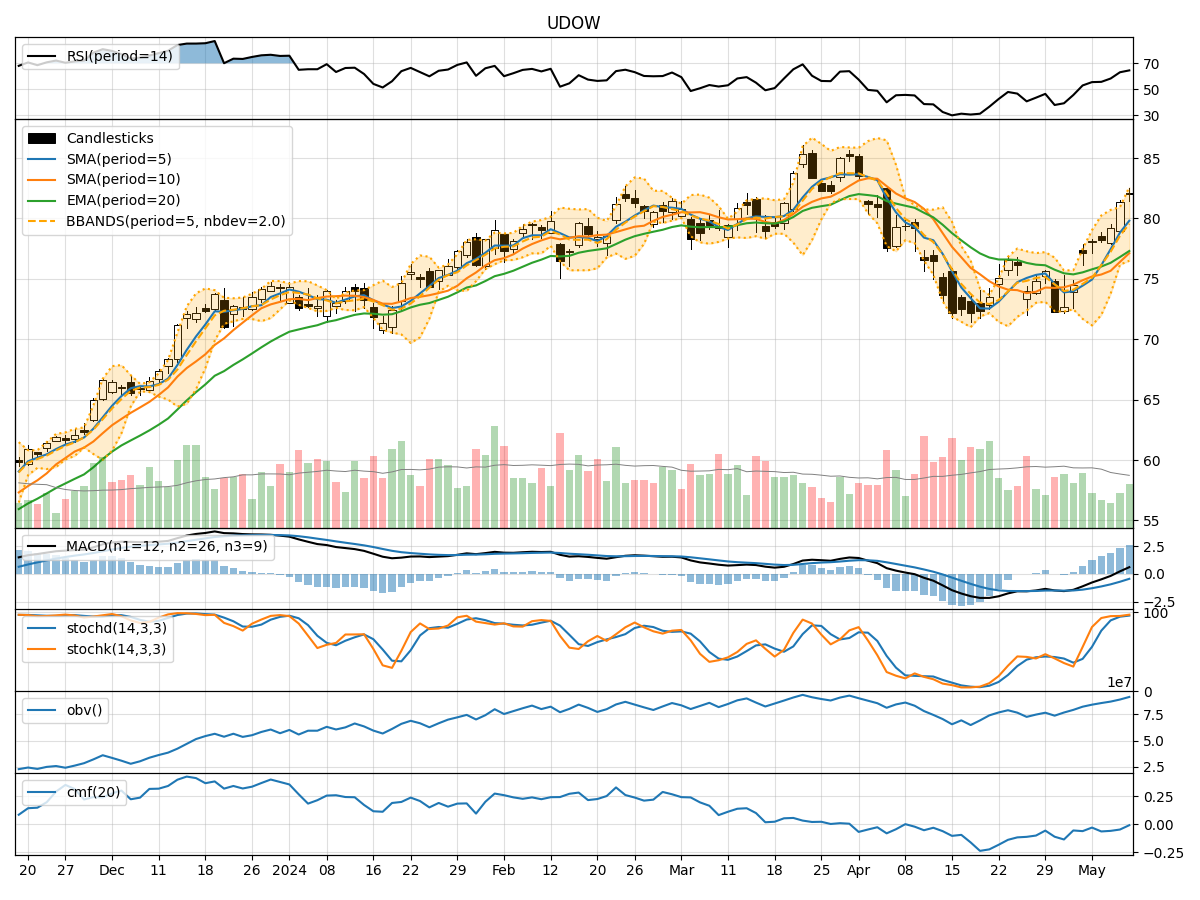
- Moving Averages (MA): The 5-day Moving Average has been consistently rising, indicating a bullish trend in the short term.
- MACD: The MACD line has been above the signal line for the past 5 days, suggesting a bullish momentum.
- RSI: The Relative Strength Index has been increasing, showing strengthening buying pressure.
Key Observation: The trend indicators point towards a bullish sentiment in the stock price movement.
Momentum Analysis:
- Stochastic Oscillator: Both %K and %D have been in the overbought zone, indicating a strong bullish momentum.
- Williams %R: The Williams %R is in the oversold territory, suggesting a potential reversal in the short term.
Key Observation: Momentum indicators signal a strong bullish sentiment in the stock.
Volatility Analysis:
- Bollinger Bands (BB): The stock price has been consistently trading above the upper Bollinger Band, indicating high volatility and potential overbought conditions.
- Volatility Bands: The volatility bands have been widening, suggesting increased price fluctuations.
Key Observation: Volatility indicators imply a highly volatile trading environment.
Volume Analysis:
- On-Balance Volume (OBV): The OBV has been steadily increasing, indicating strong buying volume.
- Chaikin Money Flow (CMF): The CMF has been negative, suggesting some distribution in the stock.
Key Observation: Volume indicators show mixed signals with strong buying volume but negative CMF.
Conclusion:
Based on the analysis of trend, momentum, volatility, and volume indicators, the overall outlook for UDOW in the next few days is bullish with a potential for further price appreciation. The strong bullish trend and momentum indicators, coupled with high volatility, indicate a favorable environment for potential price growth. However, investors should be cautious of the overbought conditions highlighted by the Bollinger Bands and Stochastic Oscillator. It is advisable to closely monitor the price action and consider risk management strategies in this volatile market environment.
In conclusion, the next few days are likely to see upward movement in UDOW's stock price, driven by the prevailing bullish sentiment and strong momentum. Investors with a high-risk tolerance may consider capitalizing on potential opportunities in this market scenario.