Technical Analysis of UEVM 2024-05-10
Overview:
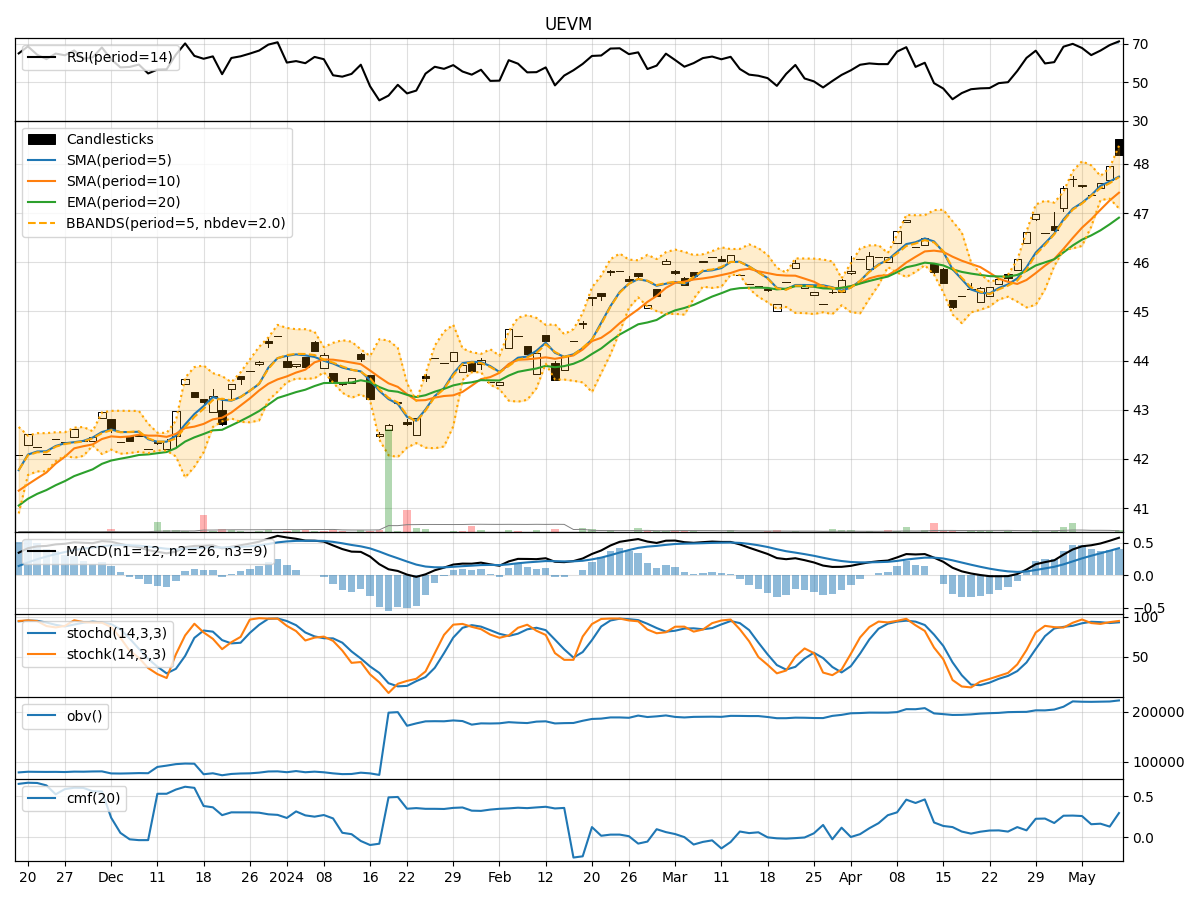
In analyzing the technical indicators for UEVM stock over the last 5 days, we will delve into the trend, momentum, volatility, and volume indicators to provide a comprehensive outlook on the possible stock price movement in the coming days. By examining these key aspects, we aim to offer valuable insights and recommendations for potential investors.
Trend Analysis:
- Moving Averages (MA): The 5-day Moving Average (MA) has been consistently above the Simple Moving Average (SMA) and Exponential Moving Average (EMA), indicating a bullish trend.
- MACD: The MACD line has been consistently above the signal line, with both lines showing an upward trend, suggesting bullish momentum.
Key Observation: The trend indicators point towards a bullish sentiment in the stock price movement.
Momentum Analysis:
- RSI: The Relative Strength Index (RSI) has been increasing and is currently in the overbought territory, indicating strong buying momentum.
- Stochastic Oscillator: Both %K and %D lines of the Stochastic Oscillator are in the overbought zone, suggesting a potential reversal.
Key Observation: Momentum indicators signal a potential reversal due to overbought conditions.
Volatility Analysis:
- Bollinger Bands (BB): The stock price has been trading within the Bollinger Bands, with the bands widening slightly, indicating increased volatility.
Key Observation: Volatility has slightly increased, which could lead to larger price swings.
Volume Analysis:
- On-Balance Volume (OBV): The OBV has been steadily increasing, indicating strong buying pressure.
- Chaikin Money Flow (CMF): The CMF is positive, suggesting that money is flowing into the stock.
Key Observation: Volume indicators reflect positive buying pressure in the stock.
Conclusion:
Based on the analysis of the technical indicators, the stock is currently in a bullish trend with strong buying momentum and positive volume indicators. However, the overbought conditions in the momentum indicators and increased volatility suggest a potential reversal or consolidation in the near future. Investors should closely monitor the price action for signs of a reversal or continuation of the bullish trend.
Recommendation:
- Short-term: Consider taking profits or setting tight stop-loss orders due to overbought momentum indicators.
- Long-term: Hold positions but remain vigilant for any signs of a trend reversal.
By combining insights from trend, momentum, volatility, and volume indicators, investors can make informed decisions to navigate the market dynamics effectively.