Technical Analysis of UFIV 2024-05-10
Overview:
In analyzing the technical indicators for UFIV over the last 5 days, we will delve into the trend, momentum, volatility, and volume indicators to provide a comprehensive outlook on the possible stock price movement in the coming days. By examining these key aspects, we aim to offer valuable insights and predictions for potential investors.
Trend Analysis:
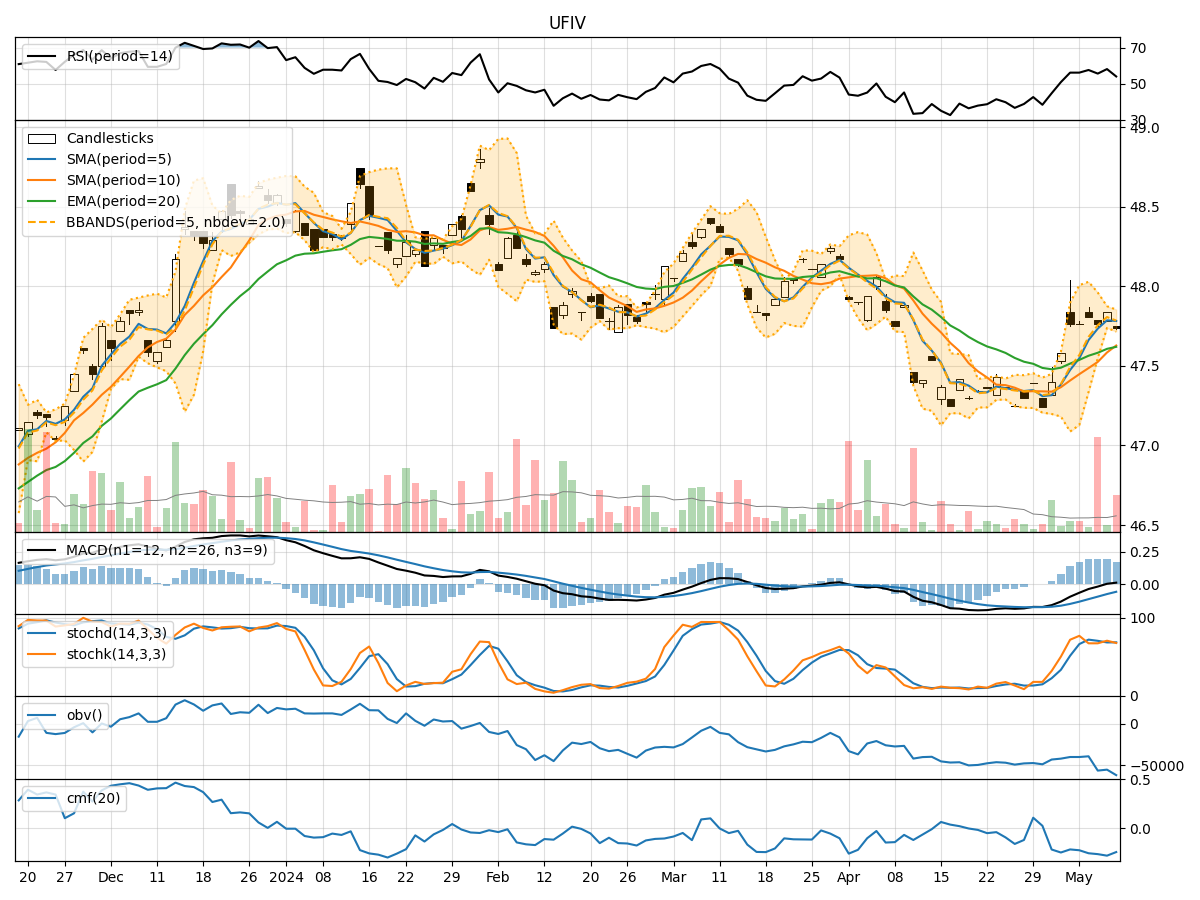
- Moving Averages (MA): The 5-day Moving Average (MA) has been consistently above the Simple Moving Average (SMA) and Exponential Moving Average (EMA), indicating a short-term uptrend.
- MACD: The MACD line has been positive, suggesting bullish momentum in the stock price.
- MACD Histogram: The MACD Histogram has been increasing, indicating strengthening bullish momentum.
Momentum Analysis:
- RSI: The Relative Strength Index (RSI) has been fluctuating around the 50 level, indicating a neutral momentum.
- Stochastic Oscillator: Both %K and %D have been hovering around the mid-level, suggesting a lack of strong directional momentum.
- Williams %R: The Williams %R is showing oversold conditions, potentially signaling a reversal in the short term.
Volatility Analysis:
- Bollinger Bands (BB): The stock price has been trading within the Bollinger Bands, with the bands narrowing, indicating decreasing volatility.
- Bollinger %B: The %B indicator is below 1, suggesting the price is below the upper band and potentially oversold.
Volume Analysis:
- On-Balance Volume (OBV): The OBV has been declining, indicating selling pressure in the stock.
- Chaikin Money Flow (CMF): The CMF has been negative, reflecting a lack of buying interest in the stock.
Key Observations:
- The trend indicators suggest a bullish bias in the short term.
- Momentum indicators show a neutral stance with a potential for a reversal.
- Volatility is decreasing, indicating a possible period of consolidation.
- Volume indicators point towards selling pressure and a lack of significant buying interest.
Conclusion:
Based on the analysis of the technical indicators, the next few days for UFIV stock price movement could see sideways consolidation with a slight upward bias. Traders may expect the stock to trade within a range as volatility decreases, but caution is advised due to the mixed signals from momentum and volume indicators. It is recommended to closely monitor key support and resistance levels for potential breakout or breakdown scenarios.