Technical Analysis of UFO 2024-05-10
Overview:
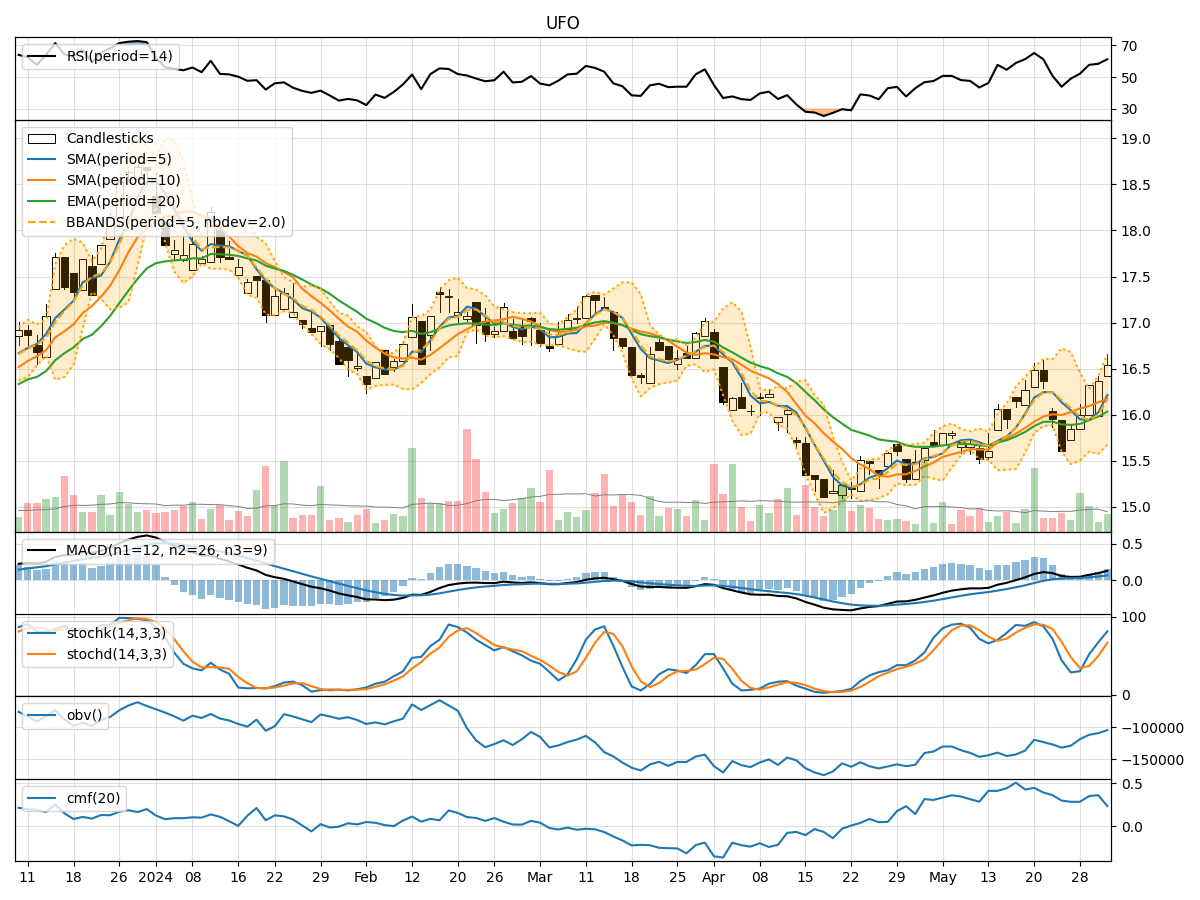
In analyzing the technical indicators for UFO stock over the last 5 days, we will delve into the trend, momentum, volatility, and volume indicators to provide a comprehensive outlook on the possible stock price movement in the coming days. By examining these key indicators, we aim to offer valuable insights and predictions for potential investors.
Trend Analysis:
- Moving Averages (MA): The 5-day Moving Average (MA) has been fluctuating around the closing prices, indicating a lack of clear trend direction.
- MACD and Signal Line: The MACD line has been consistently below the signal line, suggesting a bearish momentum in the short term.
- Relative Strength Index (RSI): The RSI has been hovering around the neutral zone, indicating a balanced buying and selling pressure.
Momentum Analysis:
- Stochastic Oscillator: The Stochastic Oscillator has been declining, moving towards the oversold territory, signaling a potential reversal in the stock price.
- Williams %R (Willr): The Williams %R indicator has been in the oversold region, indicating a possible buying opportunity.
Volatility Analysis:
- Bollinger Bands (BB): The Bollinger Bands have been narrowing, suggesting a decrease in volatility and a potential period of consolidation.
- Bollinger Band %B (bbp): The %B indicator has been relatively low, indicating a possible oversold condition.
Volume Analysis:
- On-Balance Volume (OBV): The OBV has been declining, indicating a divergence between price and volume, which could signal a potential trend reversal.
- Chaikin Money Flow (CMF): The CMF has been decreasing, suggesting a decrease in buying pressure.
Key Observations:
- The stock is currently exhibiting mixed signals across different indicators, with some pointing towards a potential reversal or consolidation.
- The declining momentum indicators and volume divergence raise concerns about the sustainability of the current trend.
- The narrowing Bollinger Bands and decreasing volatility indicate a period of consolidation or a potential breakout in the near future.
Conclusion:
Based on the analysis of the technical indicators, the stock price of UFO is likely to experience a period of consolidation in the coming days. The mixed signals from the trend, momentum, volatility, and volume indicators suggest a lack of clear direction, emphasizing the need for caution in making trading decisions. Investors should closely monitor key support and resistance levels for potential breakout opportunities.