Technical Analysis of UGE 2024-05-10
Overview:
In analyzing the technical indicators for UGE stock over the last 5 days, we will delve into the trend, momentum, volatility, and volume indicators to provide a comprehensive outlook on the possible stock price movement in the coming days. By examining these key factors, we aim to offer valuable insights and predictions to guide investment decisions.
Trend Indicators:
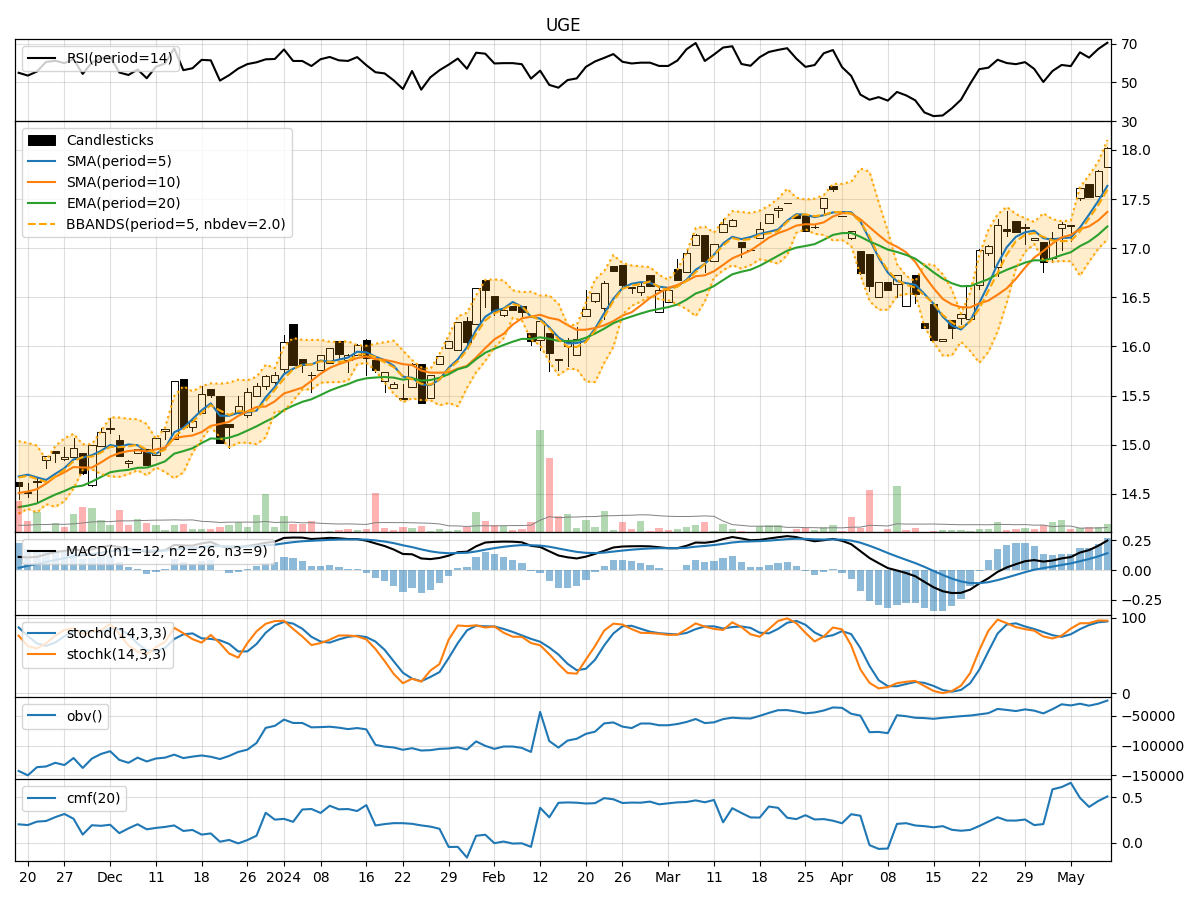
- Moving Averages (MA): The 5-day Moving Average has been consistently above the closing prices, indicating a short-term uptrend.
- MACD: The MACD line has been trending upwards, with the MACD histogram showing an increasing positive momentum.
- EMA: The Exponential Moving Average has been steadily rising, supporting the bullish trend.
Momentum Indicators:
- RSI: The Relative Strength Index has been in the overbought territory, suggesting a strong bullish momentum.
- Stochastic Oscillator: Both %K and %D lines have been in the overbought zone, indicating a potential reversal or consolidation.
- Williams %R: The indicator has been hovering near the oversold region, signaling a potential buying opportunity.
Volatility Indicators:
- Bollinger Bands: The stock price has been trading near the upper Bollinger Band, indicating high volatility and a potential overbought condition.
- Bollinger %B: The %B indicator suggests that the stock is trading close to the upper band, signaling a possible reversal or pullback.
Volume Indicators:
- On-Balance Volume (OBV): The OBV has been trending upwards, indicating accumulation and buying pressure.
- Chaikin Money Flow (CMF): The CMF has been positive, reflecting strong buying interest over the past 20 days.
Key Observations and Opinions:
- Trend: The trend indicators suggest a strong bullish sentiment in the short term.
- Momentum: While the momentum indicators show overbought conditions, the RSI and Stochastic Oscillator suggest a potential reversal or consolidation.
- Volatility: High volatility near the upper Bollinger Band indicates a possible pullback or correction.
- Volume: Increasing OBV and positive CMF point towards continued buying interest.
Conclusion:
Based on the analysis of the technical indicators, the stock is currently in an overbought state with strong bullish momentum. However, the high volatility and potential reversal signals from the Stochastic Oscillator and Williams %R indicate a possible consolidation or pullback in the coming days. Traders should exercise caution and consider taking profits or implementing risk management strategies in anticipation of a short-term correction.