Technical Analysis of UGL 2024-05-10
Overview:
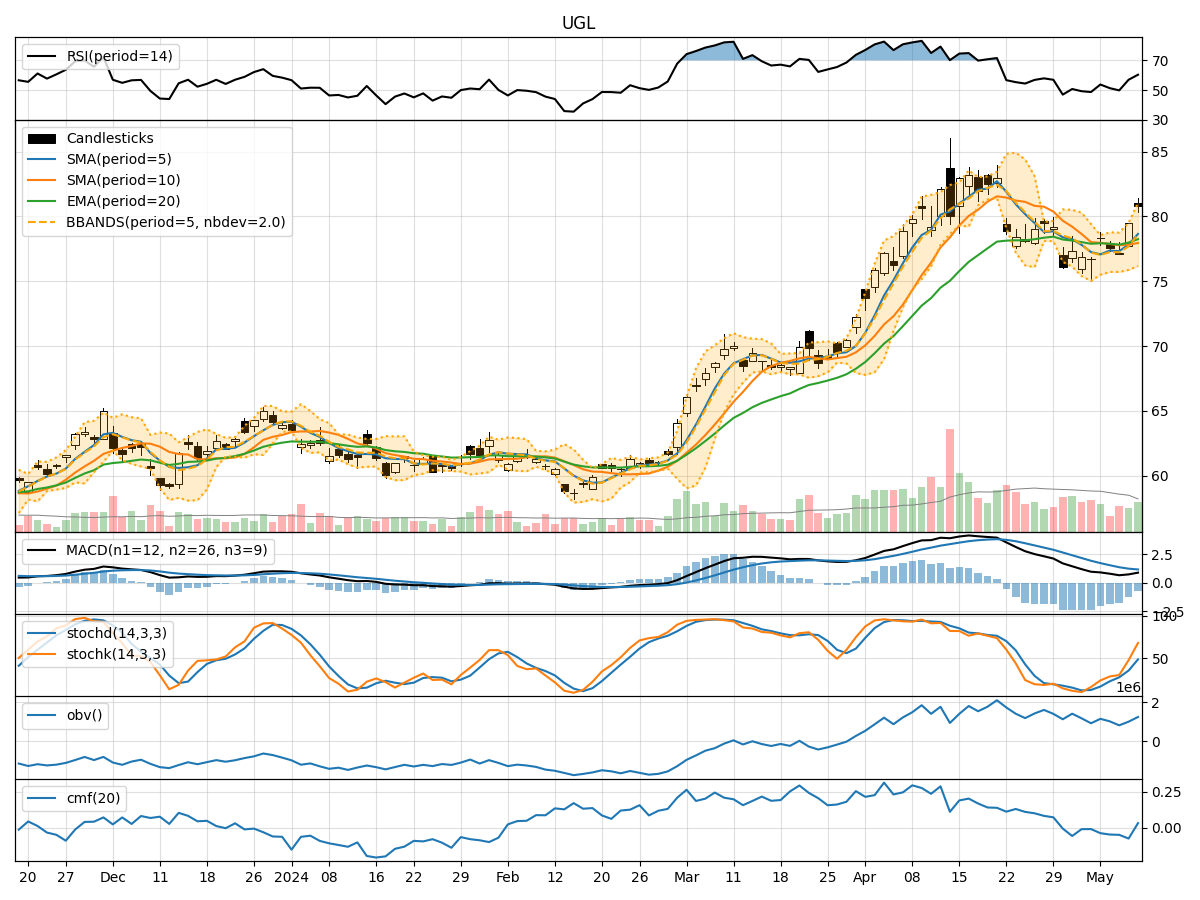
In the last 5 trading days, UGL stock has shown mixed signals across various technical indicators. The trend indicators suggest a slight bullish sentiment, with the moving averages trending upwards. Momentum indicators show a potential for a bullish trend, while volatility indicators indicate increasing price fluctuations. Volume indicators show a mixed sentiment with a slight increase in buying pressure.
Trend Indicators:
- Moving Averages (MA): The 5-day MA is trending above the 10-day SMA, indicating a short-term bullish trend. The EMA(20) is also showing an upward trend, supporting a bullish sentiment.
- MACD: The MACD line is above the signal line, indicating a bullish momentum. The MACD histogram is also in positive territory, suggesting upward momentum.
Momentum Indicators:
- RSI: The RSI is above 50, indicating a potential bullish momentum. However, it is not in overbought territory, suggesting room for further upside.
- Stochastic Oscillator: Both %K and %D lines are in the overbought zone, indicating a potential reversal or consolidation in the short term.
- Williams %R: The Williams %R is in the oversold territory, suggesting a potential buying opportunity.
Volatility Indicators:
- Bollinger Bands: The price has been touching the upper Bollinger Band, indicating overbought conditions. This could suggest a potential reversal or consolidation in the near term.
- Bollinger %B: The %B is above 0.8, indicating an overbought condition. This could signal a potential pullback in the stock price.
Volume Indicators:
- On-Balance Volume (OBV): The OBV has been relatively flat, indicating a balance between buying and selling pressure.
- Chaikin Money Flow (CMF): The CMF is negative, suggesting a slight outflow of money from the stock.
Conclusion:
Based on the analysis of the technical indicators, the next few days' possible stock price movement for UGL could see a short-term pullback or consolidation. The overbought conditions indicated by the Stochastic Oscillator, Williams %R, Bollinger Bands, and %B suggest a potential reversal in the near term. The mixed sentiment in volume indicators also supports the idea of a temporary pause in the bullish momentum.
Key Points: - Short-Term: Expect a pullback or consolidation in the stock price. - Long-Term: The overall trend remains bullish, but a short-term correction is likely. - Caution: Watch for signs of reversal at overbought levels in the Stochastic Oscillator and Bollinger Bands.
It is essential to monitor the price action closely and wait for confirmation signals before making any trading decisions.