Technical Analysis of UJAN 2024-05-10
Overview:
In analyzing the technical indicators for UJAN stock over the last 5 days, we will delve into the trends, momentum, volatility, and volume indicators to provide a comprehensive outlook on the possible stock price movement in the coming days.
Trend Indicators:
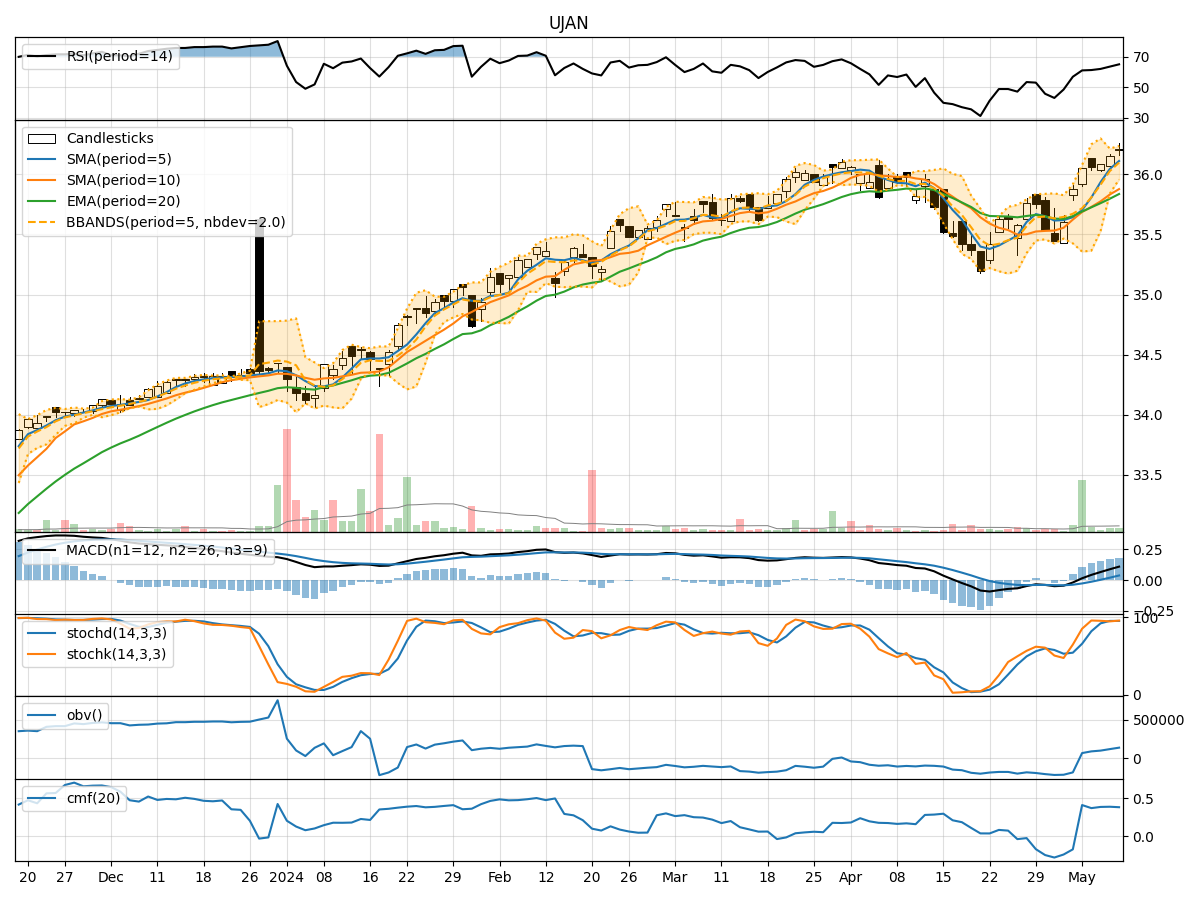
- Moving Averages (MA): The 5-day Moving Average (MA) has been consistently above the Simple Moving Average (SMA) and Exponential Moving Average (EMA), indicating a bullish trend.
- MACD: The MACD line has been consistently above the signal line, with both lines showing an upward trend, suggesting bullish momentum.
- MACD Histogram: The MACD Histogram has been increasing over the past 5 days, indicating strengthening bullish momentum.
Momentum Indicators:
- RSI: The Relative Strength Index (RSI) has been gradually increasing and is currently in the overbought territory, suggesting a strong bullish momentum.
- Stochastic Oscillator: Both %K and %D lines of the Stochastic Oscillator are in the overbought zone, indicating a strong bullish momentum.
- Williams %R: The Williams %R is in the oversold territory, suggesting a potential reversal in the bullish momentum.
Volatility Indicators:
- Bollinger Bands (BB): The stock price has been consistently trading above the middle Bollinger Band (BBM), indicating an upward trend.
- Bollinger Band Width (BBW): The Bollinger Band Width has been narrowing, suggesting decreasing volatility.
- Bollinger Band %B (BBP): The %B indicator is above 0.5, indicating a bullish trend.
Volume Indicators:
- On-Balance Volume (OBV): The OBV has been gradually increasing, indicating accumulation by investors.
- Chaikin Money Flow (CMF): The CMF has been positive over the past 5 days, suggesting buying pressure in the stock.
Key Observations and Opinions:
- Trend: The trend indicators suggest a strong bullish trend in UJAN stock.
- Momentum: Momentum indicators indicate a strong bullish momentum, but the Williams %R in the oversold territory may signal a potential reversal.
- Volatility: Volatility indicators show decreasing volatility, which could lead to a period of consolidation.
- Volume: Volume indicators suggest accumulation and buying pressure in the stock.
Conclusion:
Based on the analysis of the technical indicators, the next few days for UJAN stock are likely to see continued upward movement with a bullish bias. However, caution should be exercised as the Williams %R indicator signals a potential reversal in momentum. Traders and investors may consider taking profits or implementing risk management strategies in case of a trend reversal.