Technical Analysis of UJUL 2024-05-10
Overview:
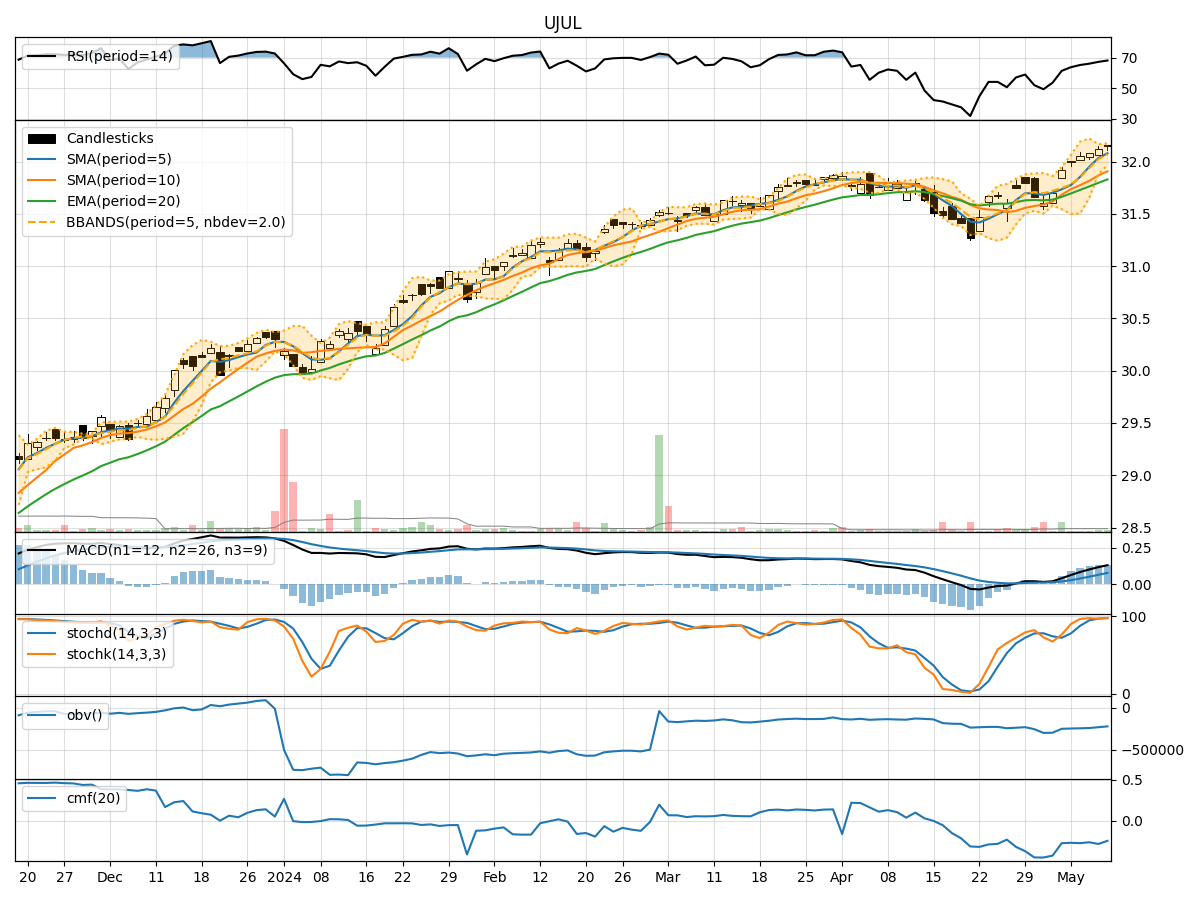
In analyzing the technical indicators for UJUL stock over the last 5 days, we will delve into the trend, momentum, volatility, and volume indicators to provide a comprehensive outlook on the possible stock price movement in the coming days. By examining these key indicators, we aim to offer valuable insights and predictions for potential investors.
Trend Indicators:
- Moving Averages (MA): The 5-day Moving Average (MA) has been consistently above the Simple Moving Average (SMA) and Exponential Moving Average (EMA), indicating a bullish trend.
- MACD: The MACD line has been consistently above the signal line, with both lines showing an upward trajectory, suggesting a bullish momentum.
Momentum Indicators:
- RSI: The Relative Strength Index (RSI) has been steadily increasing and is currently in the overbought territory, indicating a strong bullish momentum.
- Stochastic Oscillator: Both %K and %D lines of the Stochastic Oscillator are in the overbought zone, signaling a potential reversal or consolidation.
Volatility Indicators:
- Bollinger Bands (BB): The stock price has been trading within the upper Bollinger Band, suggesting an overbought condition and a possible reversal or consolidation.
Volume Indicators:
- On-Balance Volume (OBV): The OBV has been increasing over the last 5 days, indicating accumulation by investors.
- Chaikin Money Flow (CMF): The CMF has been negative, suggesting selling pressure in the stock.
Key Observations:
- The trend indicators and momentum indicators both point towards a bullish sentiment in the stock.
- However, the overbought conditions in the RSI and Stochastic Oscillator indicate a potential reversal or consolidation in the near future.
- The volatility indicators suggest that the stock price may consolidate or pull back from the overbought levels.
- The volume indicators show accumulation in the stock, but the negative CMF indicates selling pressure.
Conclusion:
Based on the analysis of the technical indicators, the next few days' possible stock price movement for UJUL is likely to experience a short-term consolidation or pullback. The bullish trend and momentum may pause as the stock price corrects from the overbought levels indicated by the RSI and Stochastic Oscillator. Traders should be cautious of a potential reversal or sideways movement in the stock price in the coming days.