Technical Analysis of UJUN 2024-05-10
Overview:
In analyzing the technical indicators for UJUN stock over the last 5 days, we will delve into the trends, momentum, volatility, and volume indicators to provide a comprehensive outlook on the possible stock price movement in the coming days. By examining these key indicators, we aim to offer valuable insights and recommendations for potential investors.
Trend Indicators:
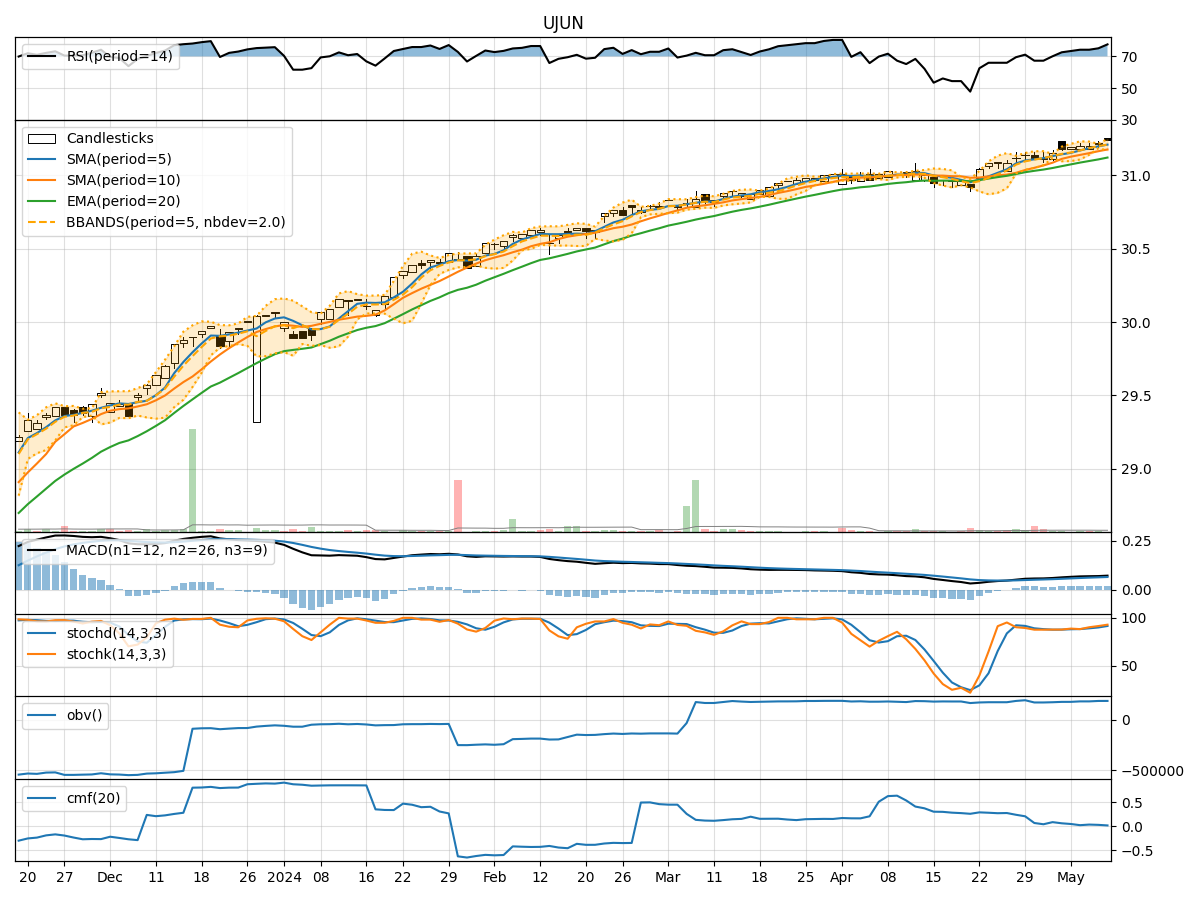
- Moving Averages (MA): The 5-day MA has been consistently above the 10-day SMA, indicating a short-term bullish trend. The EMA(20) has shown a gradual uptrend, suggesting positive momentum in the stock price.
- MACD: The MACD line has been consistently above the signal line, indicating a bullish trend. The MACD histogram has been increasing, reflecting strengthening bullish momentum.
Momentum Indicators:
- RSI: The RSI has been in the overbought territory, indicating a strong bullish momentum in the stock. However, caution should be exercised as extremely high RSI levels could potentially lead to a reversal.
- Stochastic Oscillator: Both %K and %D lines have been in the overbought zone, suggesting a strong bullish momentum. Traders should be cautious of a potential reversal when the indicators remain in the overbought region for an extended period.
- Williams %R: The Williams %R has been consistently in the oversold region, indicating a strong bullish sentiment. However, extreme levels of %R could signal a potential reversal.
Volatility Indicators:
- Bollinger Bands: The stock price has been trading within the upper Bollinger Band, indicating an overbought condition. Traders should be cautious of a possible pullback or consolidation.
- Average True Range (ATR): The ATR has shown relatively low volatility, suggesting a stable price movement in the stock.
Volume Indicators:
- On-Balance Volume (OBV): The OBV has shown a slight increase over the last 5 days, indicating a positive accumulation of the stock. This aligns with the bullish momentum indicated by other indicators.
- Chaikin Money Flow (CMF): The CMF has been positive over the past few days, indicating buying pressure in the stock.
Conclusion:
Based on the analysis of the technical indicators, the stock is currently in a strong bullish trend with positive momentum and accumulation. However, caution should be exercised as some indicators are showing signs of being in the overbought region. Traders should closely monitor the RSI, Stochastic Oscillator, and Williams %R for potential reversals. The stock price may continue to trend upwards in the short term, but a pullback or consolidation could be expected due to the overbought conditions. Overall, a cautiously bullish view is recommended for the next few days.