Technical Analysis of UMAR 2024-05-10
Overview:
In analyzing the technical indicators for UMAR stock over the last 5 days, we will delve into the trend, momentum, volatility, and volume indicators to provide a comprehensive outlook on the possible stock price movement in the coming days. By examining these key indicators, we aim to offer valuable insights and predictions for potential investors.
Trend Analysis:
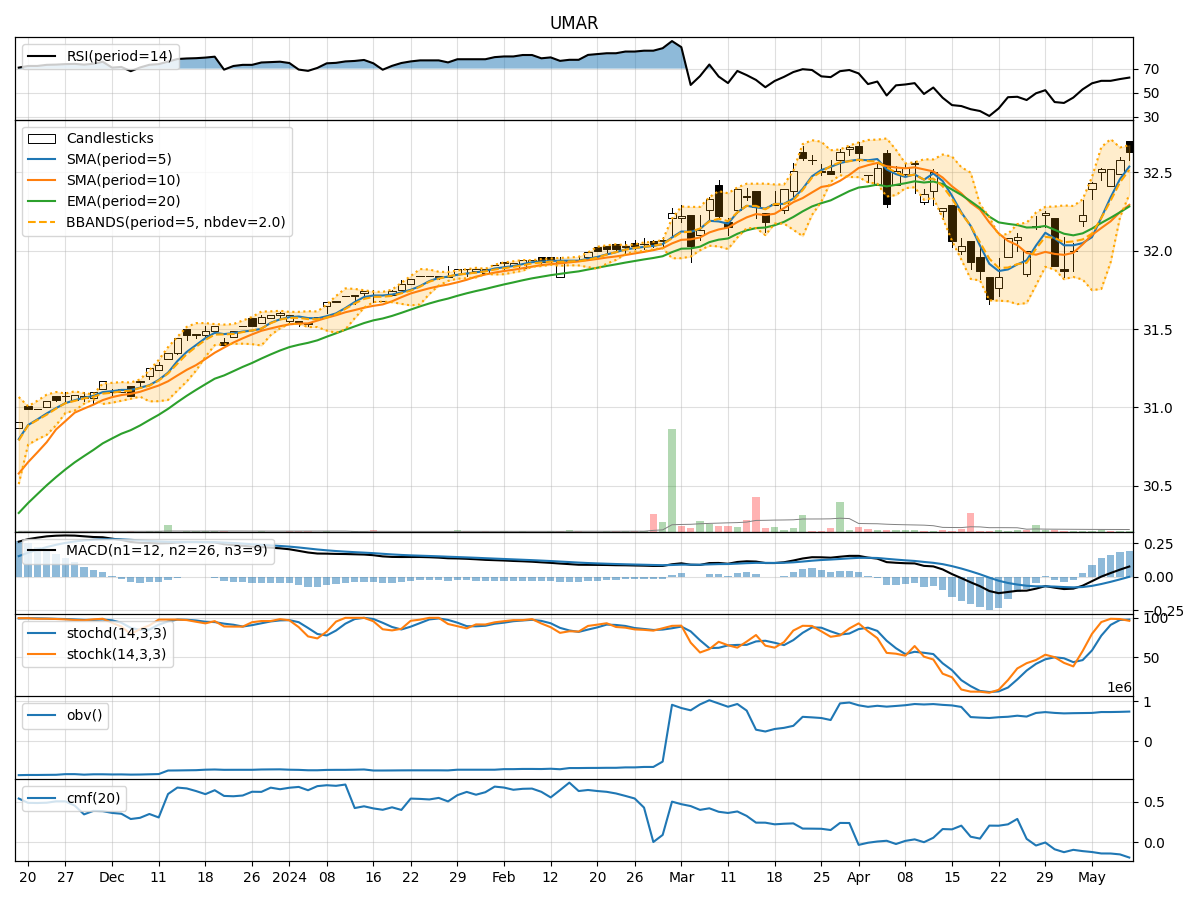
- Moving Averages (MA): The 5-day Moving Average (MA) has been consistently above the Simple Moving Average (SMA) and Exponential Moving Average (EMA), indicating a bullish trend.
- MACD: The MACD line has been consistently above the signal line, with both lines showing an upward trend, suggesting bullish momentum.
- RSI: The Relative Strength Index (RSI) has been increasing, indicating strengthening buying pressure.
Key Observation: The trend indicators suggest a strong bullish sentiment in the stock price movement.
Momentum Analysis:
- Stochastic Oscillator: Both %K and %D lines of the Stochastic Oscillator have been in the overbought zone, indicating a strong bullish momentum.
- Williams %R: The Williams %R has been consistently in the oversold territory, suggesting a potential reversal in the bullish momentum.
Key Observation: Momentum indicators reflect a strong bullish momentum, but the Williams %R signals a possible correction in the short term.
Volatility Analysis:
- Bollinger Bands (BB): The stock price has been trading within the upper Bollinger Band (BBU), indicating high volatility.
- Bollinger Band Width (BBW): The BBW has been narrowing, suggesting a potential decrease in volatility.
Key Observation: Volatility indicators show high volatility in the stock price, but the narrowing Bollinger Band Width may signal a period of consolidation.
Volume Analysis:
- On-Balance Volume (OBV): The OBV has been increasing, indicating higher buying volume.
- Chaikin Money Flow (CMF): The CMF has been negative, suggesting a lack of buying pressure.
Key Observation: Volume indicators show conflicting signals, with OBV indicating buying pressure and CMF reflecting a lack of significant buying interest.
Conclusion:
Based on the analysis of the technical indicators, UMAR stock is currently in a strong bullish trend with positive momentum. However, the high volatility and conflicting volume signals indicate a potential period of consolidation or a short-term correction in the stock price.
Key Conclusion: The stock is likely to experience a short-term correction or consolidation before potentially resuming its bullish trend. Investors should closely monitor the price action and key support levels for potential entry or exit points.
Remember, market dynamics can change rapidly, so it's essential to stay updated with the latest information and adjust your strategy accordingly.