Technical Analysis of UNOV 2024-05-10
Overview:
In analyzing the technical indicators for UNOV over the last 5 days, we will delve into the trend, momentum, volatility, and volume indicators to provide a comprehensive outlook on the possible stock price movement in the coming days. By examining these key aspects, we aim to offer valuable insights and predictions to guide investment decisions.
Trend Analysis:
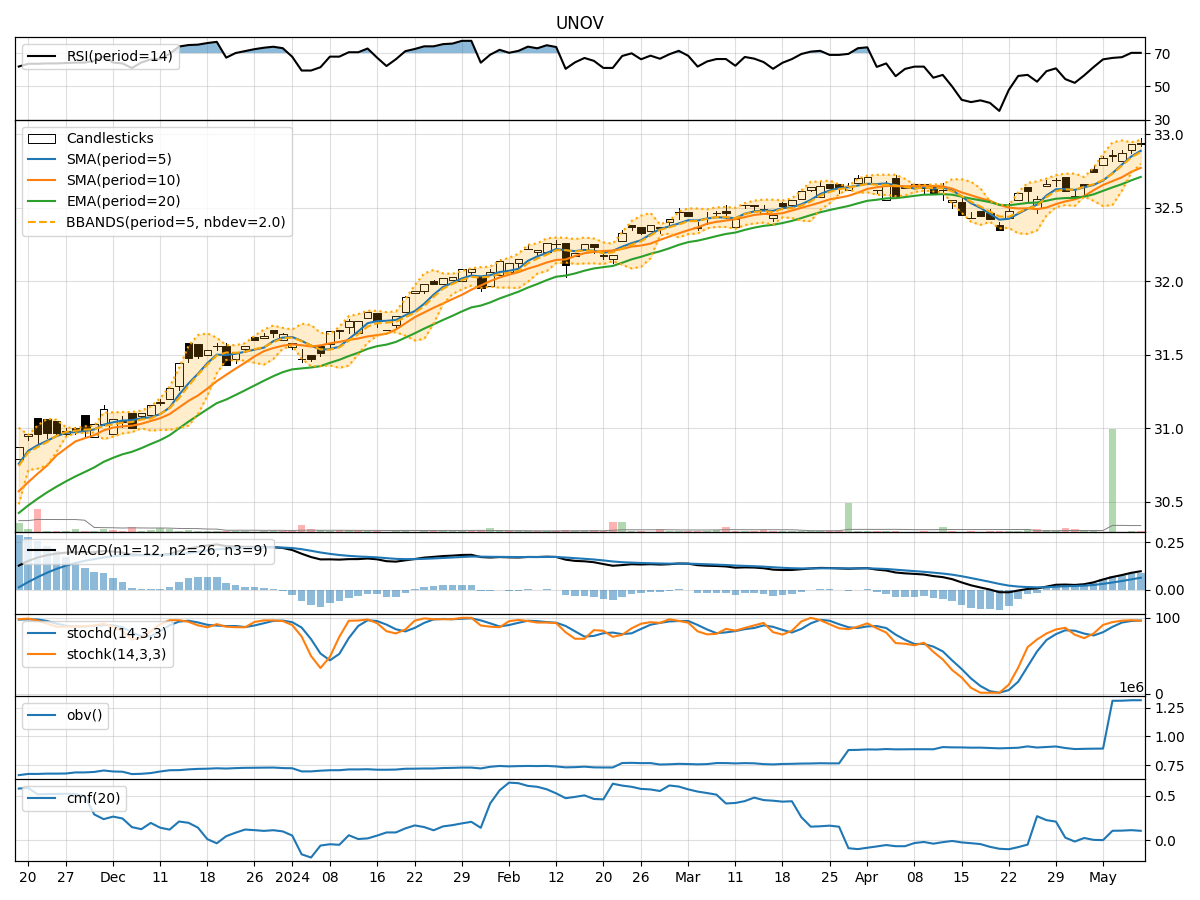
- Moving Averages (MA): The 5-day Moving Average (MA) has been consistently above the Simple Moving Average (SMA) and Exponential Moving Average (EMA), indicating a bullish trend.
- MACD: The MACD line has been consistently above the signal line, with both lines showing an upward trajectory, suggesting a bullish momentum.
Momentum Analysis:
- RSI: The Relative Strength Index (RSI) has been steadily increasing and is currently in the overbought territory, indicating a strong bullish momentum.
- Stochastic Oscillator: Both %K and %D lines of the Stochastic Oscillator are in the overbought zone, signaling a potential reversal or consolidation.
Volatility Analysis:
- Bollinger Bands (BB): The stock price has been trading within the upper Bollinger Band, suggesting an increased volatility and potential for a pullback.
Volume Analysis:
- On-Balance Volume (OBV): The OBV has been relatively flat over the last 5 days, indicating a balance between buying and selling pressure.
- Chaikin Money Flow (CMF): The CMF has shown a slight increase but remains relatively neutral, reflecting a lack of strong buying or selling sentiment.
Key Observations:
- The trend indicators suggest a strong bullish sentiment, supported by the moving averages and MACD.
- Momentum indicators indicate an overbought condition, which could lead to a potential reversal or consolidation.
- Volatility remains elevated as per the Bollinger Bands, signaling potential price fluctuations.
- Volume indicators show a lack of significant buying or selling pressure, leading to a neutral stance.
Conclusion:
Based on the analysis of the technical indicators, the stock is currently in a strong bullish trend with overbought momentum. However, the elevated volatility and lack of significant volume support caution against chasing the price higher. Expect a potential pullback or consolidation in the coming days as the stock may need to cool off from its overbought levels. Traders should exercise caution and consider waiting for a better entry point before initiating new positions.