Technical Analysis of UOCT 2024-05-10
Overview:
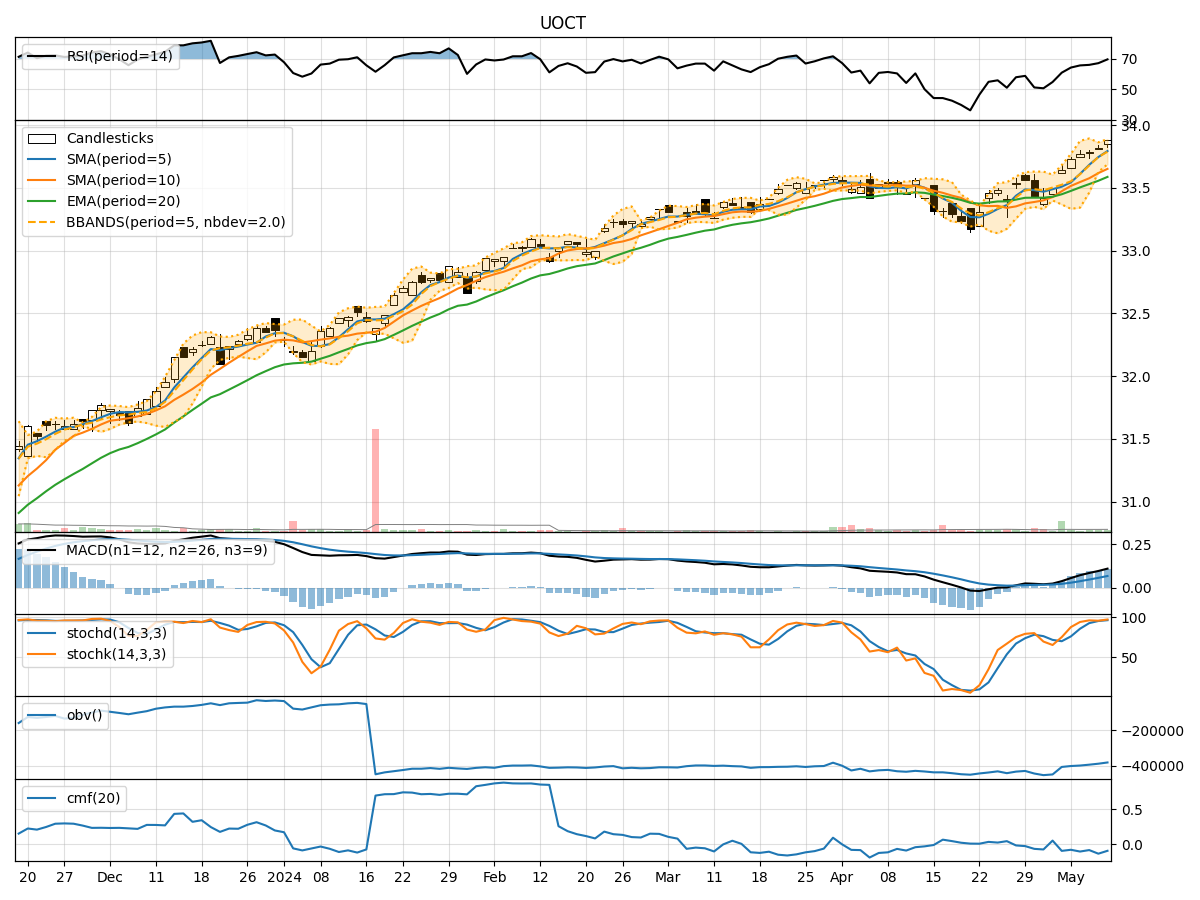
In the last 5 trading days, the stock has shown a consistent uptrend based on the moving averages, with the MACD indicating increasing bullish momentum. The RSI and Stochastic indicators suggest the stock is in overbought territory, while the Bollinger Bands show a narrowing range. Volume has been increasing, but the Chaikin Money Flow is negative, indicating some distribution.
Trend Indicators:
- Moving Averages (MA): The stock price has been consistently above the 5-day moving average, indicating a short-term uptrend.
- MACD: The MACD line has been above the signal line, showing bullish momentum.
- EMA: The exponential moving average has been trending upwards, supporting the bullish sentiment.
Key Observation: The trend indicators suggest a strong bullish trend in the short term.
Momentum Indicators:
- RSI: The RSI is in overbought territory, indicating a potential reversal or consolidation.
- Stochastic Oscillator: Both %K and %D are in overbought territory, signaling a possible pullback.
- Williams %R: The Williams %R is also in oversold territory, suggesting a potential reversal.
Key Observation: Momentum indicators are signaling a potential short-term reversal or consolidation.
Volatility Indicators:
- Bollinger Bands: The Bollinger Bands are narrowing, indicating decreasing volatility and a potential breakout.
- Bollinger %B: The %B is below 1, suggesting the stock is trading below the upper band.
Key Observation: Volatility is decreasing, which could lead to a period of consolidation or a breakout.
Volume Indicators:
- On-Balance Volume (OBV): The OBV has been increasing, indicating accumulation.
- Chaikin Money Flow (CMF): The CMF is negative, suggesting some distribution despite the increasing volume.
Key Observation: Volume is increasing, but the CMF indicates potential selling pressure.
Conclusion:
Based on the technical indicators: - Short-Term: The stock is in a strong bullish trend according to trend indicators. - Momentum: Momentum indicators suggest a potential short-term reversal or consolidation. - Volatility: Volatility is decreasing, indicating a possible period of consolidation or breakout. - Volume: Despite increasing volume, the negative CMF raises concerns about distribution.
Overall Assessment:
- Short-Term View: The stock may experience a short-term pullback or consolidation due to overbought conditions and potential profit-taking.
- Long-Term View: The overall trend remains bullish, but caution is advised in the short term.
Recommendation:
- Short-Term: Consider taking profits or tightening stop-loss levels.
- Long-Term: Hold positions but monitor closely for any signs of trend reversal.
Final Verdict:
The stock is likely to experience a short-term pullback or consolidation before potentially resuming its uptrend. Investors should exercise caution and monitor key levels closely for potential entry or exit points.