Technical Analysis of UPAR 2024-05-10
Overview:
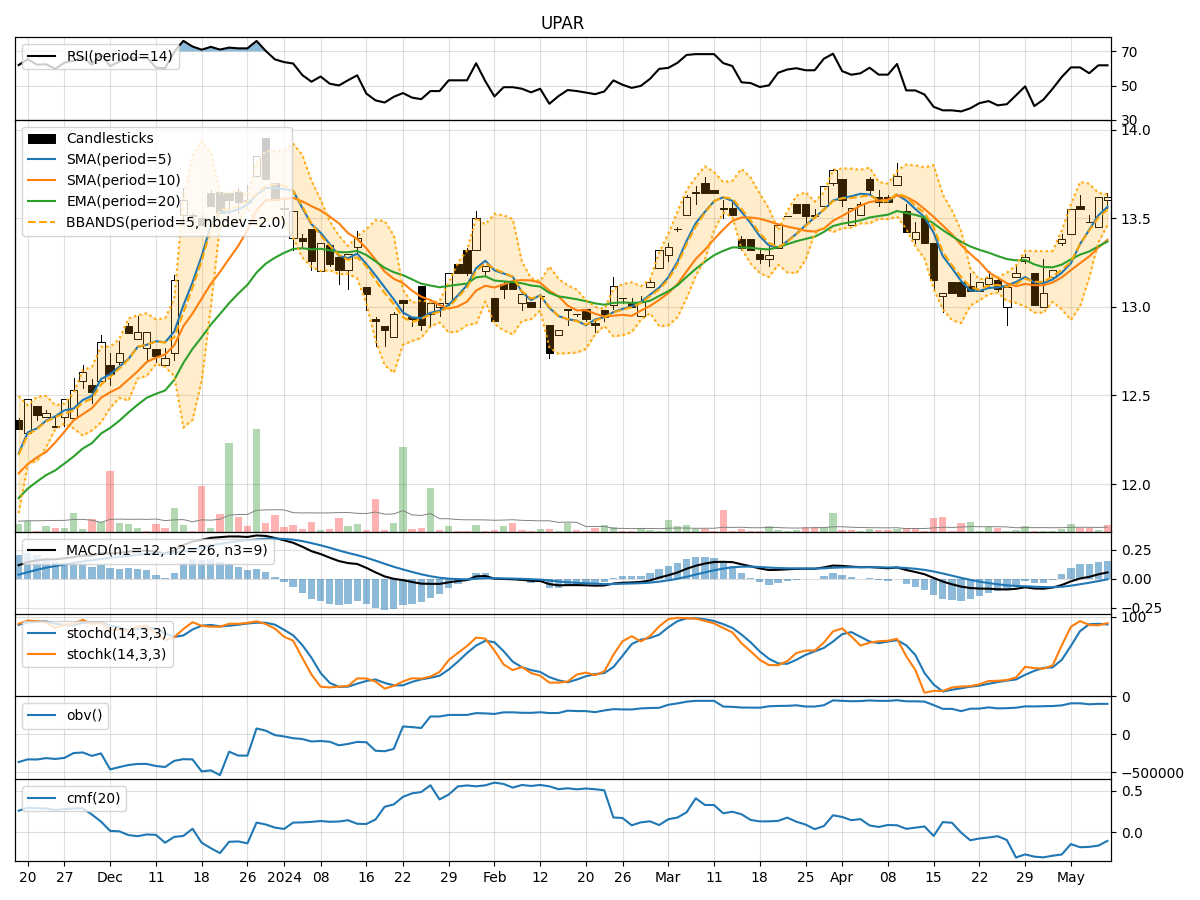
In the last 5 trading days, the stock has shown a consistent upward trend in terms of closing prices. The moving averages (MA) have been trending upwards, indicating a positive momentum. The Relative Strength Index (RSI) and Stochastic Oscillator also suggest bullish momentum. However, the Bollinger Bands (BB) are narrowing, indicating decreasing volatility. The On-Balance Volume (OBV) and Chaikin Money Flow (CMF) are slightly negative, suggesting some selling pressure.
Trend Analysis:
- Moving Averages (MA): The 5-day MA has been consistently above the 10-day Simple Moving Average (SMA), indicating a short-term bullish trend.
- MACD: The MACD line has been consistently above the signal line, indicating a bullish trend.
Momentum Analysis:
- RSI: The RSI has been in the overbought territory, suggesting a strong bullish momentum.
- Stochastic Oscillator: Both %K and %D lines are in the overbought zone, indicating a strong buying pressure.
Volatility Analysis:
- Bollinger Bands (BB): The bands are narrowing, indicating decreasing volatility and a possible consolidation phase.
Volume Analysis:
- On-Balance Volume (OBV): The OBV has been slightly negative, suggesting some distribution happening in the stock.
- Chaikin Money Flow (CMF): The CMF is also negative, indicating selling pressure.
Key Observations:
- The stock is currently in a strong bullish trend based on the moving averages and momentum indicators.
- However, the narrowing Bollinger Bands suggest a potential consolidation phase in the near future.
- The negative OBV and CMF indicate some selling pressure despite the bullish momentum.
Conclusion:
Based on the technical indicators and analysis: - Short-Term: The stock is likely to continue its upward movement in the short term due to the strong bullish momentum indicated by the RSI and Stochastic Oscillator. - Mid-Term: There might be a consolidation phase as indicated by the narrowing Bollinger Bands, which could lead to a temporary pause in the upward trend. - Long-Term: The overall trend remains bullish, but investors should monitor the OBV and CMF for any signs of increasing selling pressure.
Recommendation:
- Buy/Hold: Investors with a short to mid-term horizon can consider buying or holding the stock, taking advantage of the current bullish momentum.
- Monitor: Keep a close eye on the Bollinger Bands for signs of a potential consolidation phase and the OBV/CMF for any shifts in volume and buying/selling pressure.
Key Words:
- Upward Trend: Short-term bullish momentum.
- Consolidation: Possible near-term sideways movement.
- Bullish: Overall long-term outlook remains positive.