Technical Analysis of UPGD 2024-05-10
Overview:
In analyzing the technical indicators for UPGD over the last 5 days, we will delve into the trend, momentum, volatility, and volume indicators to provide a comprehensive outlook on the possible stock price movement in the coming days.
Trend Indicators:
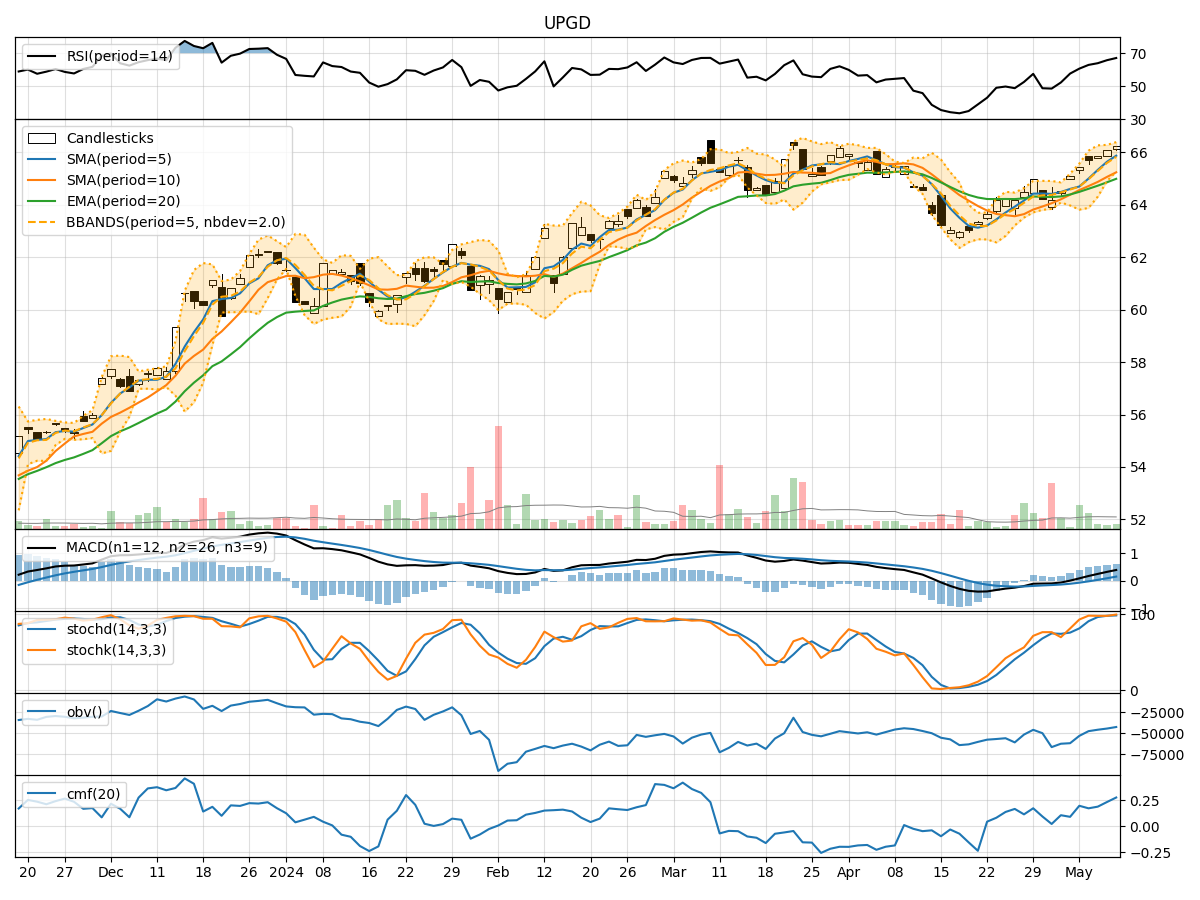
- Moving Averages (MA): The 5-day MA has been consistently above the 10-day SMA, indicating a short-term bullish trend.
- MACD: The MACD line has been trending upwards, with the MACD histogram showing positive values, suggesting increasing bullish momentum.
- EMA: The EMA has been steadily rising, reflecting a positive trend in the stock price.
Momentum Indicators:
- RSI: The RSI has been increasing, reaching overbought levels, indicating strong buying momentum.
- Stochastic Oscillator: Both %K and %D have been in the overbought zone, suggesting a potential reversal or consolidation.
- Williams %R: The indicator has been hovering around the oversold territory, signaling a possible reversal in the short term.
Volatility Indicators:
- Bollinger Bands: The stock price has been trading near the upper Bollinger Band, indicating high volatility and a potential overbought condition.
- Bollinger %B: The %B indicator is above 0.8, suggesting the stock is trading at the upper end of its recent price range.
Volume Indicators:
- On-Balance Volume (OBV): The OBV has been increasing, indicating strong buying pressure in the stock.
- Chaikin Money Flow (CMF): The CMF has been positive, reflecting a healthy inflow of money into the stock.
Key Observations:
- The stock is currently in a strong uptrend based on moving averages and MACD.
- Momentum indicators suggest a potential overbought condition, signaling a need for caution.
- Volatility indicators point to high volatility and a possible overbought scenario.
- Volume indicators show strong buying pressure and positive money flow into the stock.
Conclusion:
Based on the analysis of the technical indicators, the stock is overbought and potentially due for a correction in the short term. Caution is advised for investors looking to enter new positions at current levels. A pullback or consolidation phase could be expected in the coming days. It is recommended to monitor the price action closely and wait for a more favorable entry point before considering any new positions.